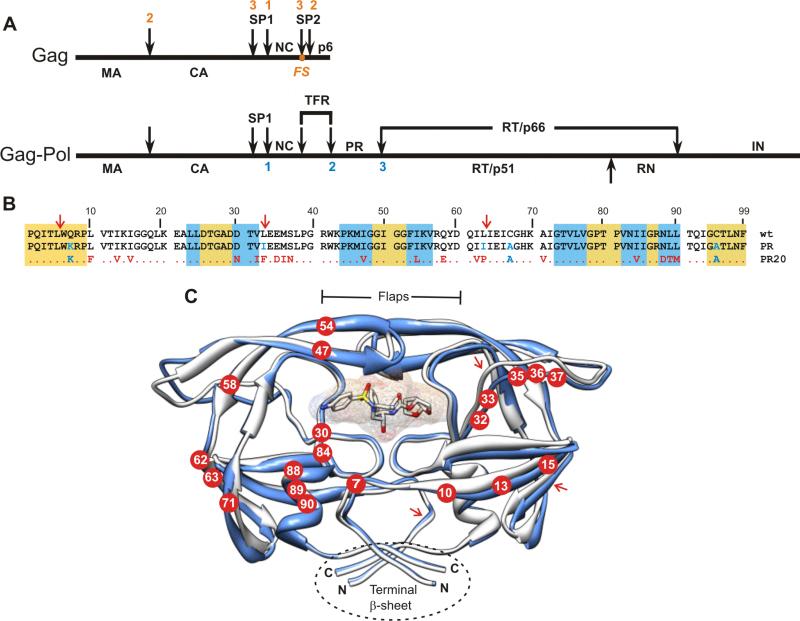
Figure 1.
(A) Organization of the Gag and Gag-Pol polyproteins of HIV-1. Nomenclature of domains in Gag:2 MA, matrix; CA, capsid; SP1, spacer peptide 1, NC, nucleocapsid; SP2, spacer peptide 2. In Gag-Pol: TFR, transframe region; PR, protease; RT, reverse transcriptase; RN, Rnase H; IN, integrase. FS designates the location of the - 1 frame shift during translation that results in production of Gag-Pol. Numbers shown above (red) and below (blue) the schematic lines designate the order in which sequential cleavages occur in Gag and in Gag-Pol respectively.2,9 (B) Sequence alignment of PR20 with wild type HIV-1 protease (PRwt) and its optimized mutant (termed PR). Residues in PR and PR20 shown in blue were introduced to limit autoproteolysis and to preclude cysteine-thiol oxidation. Residues shown in red are natural mutations in the clinical isolate from which PR20 is derived.19 The gold and white backgrounds indicate highly conserved regions in the protease domain in drug treated patients,41 and areas of greatest variability among isolates, respectively. The blue background designates regions where major DRMs (as defined in http:/hivdb.stanford.edu/cgi-bin/PIResiNote.cgi) occur. (C) Ribbon representation (in blue) of PR20 in complex with DRV (pdb accession code 3UCB13) superimposed on PR (in white, pdb accession code 2IEN30). Locations of the mutations in PR20 are shown as red circles with residue numbers in white. The DRV inhibitor is shown as a stick and surface representation in the active site cavity. Major sites of autoproteolysis are indicated in B and C with red arrows. Molecular representations were prepared using Chimera.42

