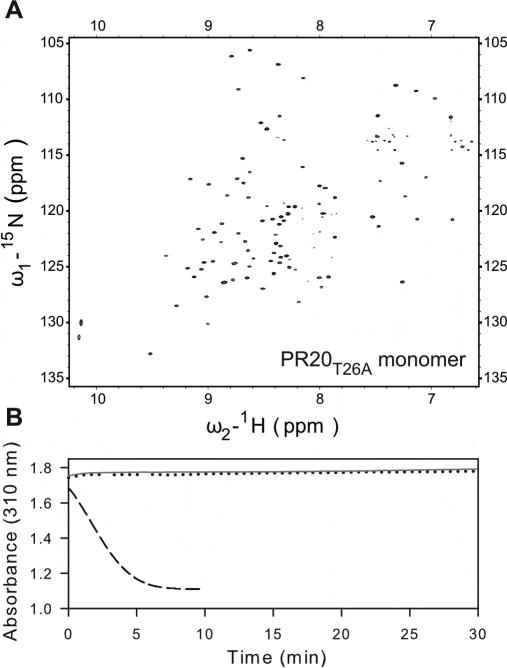
Figure 4.
(A) 600 MHz 1H-15N TROSY-HSQC spectrum of a freshly prepared uniformly 15N- and 13C-labeled PR20T26A (100 μM as monomer) in 20 mM sodium phosphate buffer, pH 5.8, 20 °C. A spectrum acquired using a 4-fold diluted sample (not shown) clearly superimposes on the one shown, indicating no changes in the monomer-dimer or tertiary fold status, and that the protein is all monomeric in conjunction with data shown in (B). (B) Activity assays with 360 μM substrate IV in 50 mM sodium acetate buffer, pH 5, containing 250 mM NaCl. Dotted black and solid gray lines are for 1 and 5 μM PR20T26A (as dimer), respectively. For comparison, the dashed line is for 300 nM active PR dimer shows depletion of substrate within 5 min.

