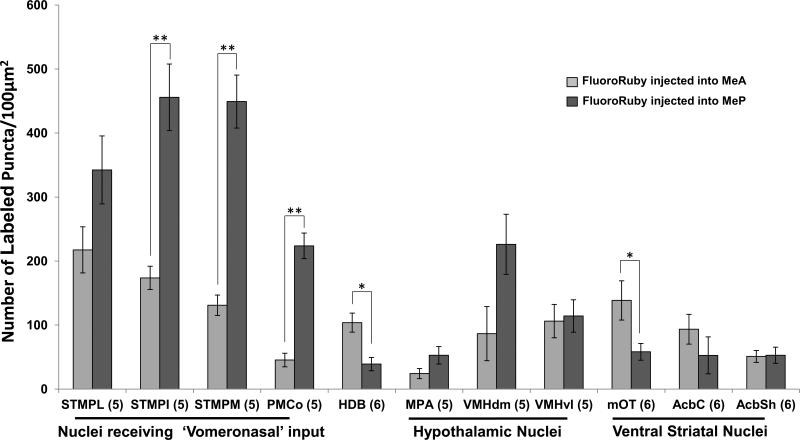
Figure 6.
Quantitative estimation of labeled puncta in animals given Fluoro-Ruby injections into either the MeA or MeP. Brain regions in which puncta were counted: STMPL, STMPI, STMPM, posterolateral, intermediate, medial divisions of the bed nucleus of the stria terminalis; PMCo, posteromedial cortical amygdala; HDB, horizontal diagonal band of Broca; MPA, medial preoptic area; VMHdm, VMHvl, dorsomedial, ventrolateral portions of the ventromedial hypothalamus; mOT, medial olfactory tubercle; AcbC, AcbSh, nucleus accumbens core, shell. Data are expressed as the mean (±SEM) calculated from confocal images merged in the Z-plane. Sample sizes for each group are shown in parentheses. *P<0.040, **P<0.001 (Two-tailed Student's t-test).

