
Figure 4.
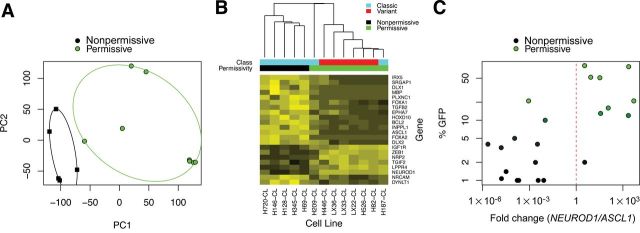
Prediction of Seneca Valley virus (SVV-001) permissivity by relative expression analysis of ASCL1 and NEUROD1. A) Microarray analysis was performed on publicly available data previously deposited in NCBI’s Gene Expression Omnibus (28) and accessible through GEO Series accession number GSE15240 (17). All analyses were performed using the Bioconductor suite for R (29). Raw intensities from.CEL files were normalized using the gcRMA algorithm and differential gene expression was assessed using the R/Bioconductor package (30). A linear model was fit for each probe to estimate expression differences between SVV-001 permissive and nonpermissive groups. The standard errors of log-2 fold change were moderated using an empirical Bayes approach. For each probe on the array, moderated t statistics, log odds ratios of differential expression (B statistics), and raw and adjusted P values (false discovery rate control by the Benjamini and Hochberg method) were calculated. Principal component analysis was done to distinguish SVV-001 permissive cell lines and nonpermissive lines. B) Hierarchical clustering of differentially expressed markers of neurogenesis (gene ontology term GO:0022008; adjusted P value cutoff <.025). C) Quantitative real-time polymerase chain reaction (PCR) of ASCL1 and NEUROD1 cDNA in a panel of small cell lung cancer cell lines and heterotransplants (n = 22). RNA was extracted from cells using TRIzol (Invitrogen) and cleaned up by RNeasy column purification (Qiagen) according to manufacturer protocols. Purified RNA was checked for degradation by ribosomal RNA integrity on a 1% agarose gel, and quantity and purity were determined by spectrophotometric measurements at A260 and A280. cDNA was synthesized using Superscript III (Invitrogen) and RNA was digested with RNase H. cDNA was used as a template for quantitative real-time PCR performed in quadruplicate using SYBR Green PCR Master Mix and a StepOnePlus thermal cycler with standard thermocycling conditions (Applied Biosystems). Primer sequences for ASCL1 (ID: 373) and NEUROD1 (ID: 116) have been previously described and are available in RTPrimerDB (31–33). Relative expression analysis was performed using the tspair package using 10% SVV–green fluorescent protein (GFP) positivity as a cutoff (34). The TSP score was defined as |Pr(X i > Y i|Class 1) − Pr(X i > Y i|Class 2)|, where X i is the gene expression measurement for the first gene of the pair for sample i and Y i is the gene expression measurement for the second gene of the pair for sample i. Leave-one-out cross-validation was performed using all samples. Log-transformed differential Ct is plotted on the horizontal axis and percentage of cells supporting infection by SVV-GFP on the vertical axis.