
Figure 1.
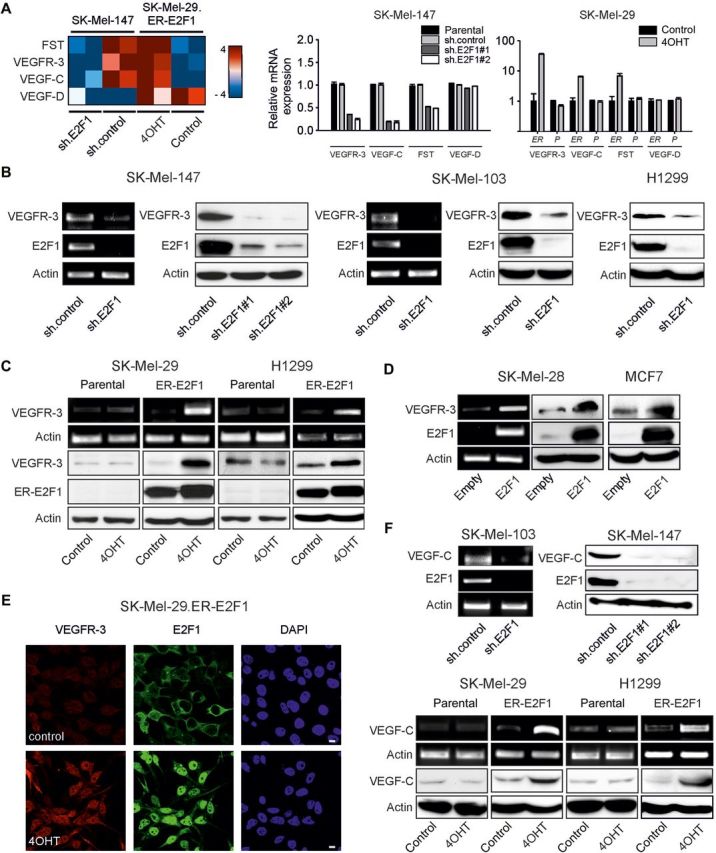
E2F1 regulates expression of tumor cell-associated VEGF-C/VEGFR-3. (A) Heat map illustration of VEGFR-3 and VEGF-C transcript abundance determined by TaqMan qRT–PCR arrays in SK-Mel-147 cells expressing control or E2F1-specific shRNA, and in stable SK-Mel-29.ER-E2F1 cells treated with 4OHT or solvent (control; left panel). Normalized mRNA expression is reported as a log2 ratio. Blue shading represents low and red shading indicates high levels of mRNA. VEGFR-3 and VEGF-C levels were verified by qPCR in SK-Mel-147 cells (using two sh.E2F1 constructs compared with sh.control as well as parental cells) and SK-Mel-29 cells (ER, stable SK-Mel-29.ER-E2F1 cells; P, parental SK-Mel-29 cells; right panels). VEGF-D was used as negative control and follistatin (FST) as positive control. (B–D) RT–PCR and immunoblotting analyses of VEGFR-3 and E2F1 expression after sh.E2F1 treatment (B), E2F1 activation by 4OHT (C), or E2F1 overexpression (D) in indicated cancer cell lines. Parental and sh.control cells served as controls. (E) Subcellular localization of VEGFR-3 (red) and E2F1 (green) in SK-Mel-29.ER-E2F1 cells treated for 24 h with 4OHT. Nuclei were counter-stained with DAPI (blue) and fluorescence was visualized by confocal laser scanning microscopy (CLSM). Scale bar, 10 µm. (F) Detection of VEGF-C mRNA and protein expression upon E2F1 depletion (top) or activation (bottom). Actin served as loading control.