
Figure 4.
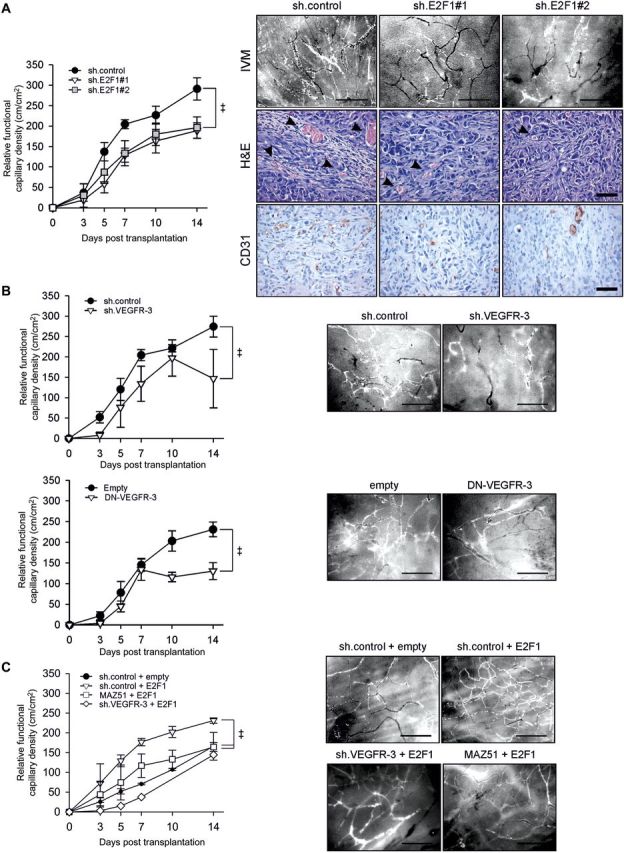
E2F1 and VEGFR-3 depleted tumors exhibit reduced neovascularization in vivo. (A) Quantitative analysis of rFCD after transplantation of SK-Mel-147 cells expressing sh.E2F1 (left; sh.control n = 8, sh.E2F1#1 n = 4, sh.E2F1#2 n = 5). Results are given in mean ± SEM. Two-way ANOVA and appropriate post hoc tests were performed. Statistical significance is P < 0.05 (‡). Representative images of intratumoral microvasculature visualized by epi-illumination fluorescence video microscopy (right, IVM). Scale bar, 200 µm. Histology of SK-Mel-147 xenografts expressing sh.control or sh.E2F1 on Day 14 after transplantation on striated muscle tissue of the dorsal skinfold in nude mice (right). Tissue sections were stained with hematoxylin-eosin (H&E) and CD31 (ab28364). Arrows indicate intratumoral vessels with erythrocytes evident in the lumen. Scale bar, 50 µm. (B) Quantitative analysis of rFCD after transplantation of SK-Mel-147 cells expressing sh.VEGFR-3 (top; n = 3/group) or DN-VEGFR-3 (bottom; n = 5/group). Representative IVM image of each group is shown. (C) The rFCD after transplantation of SK-Mel-29 cells overexpressing E2F1 (n = 2), co-treated with MAZ51 (n = 3) or co-expressing E2F1 with sh.VEGFR-3 (n = 1) compared with controls (n = 3). Representative IVM image of each group is shown.