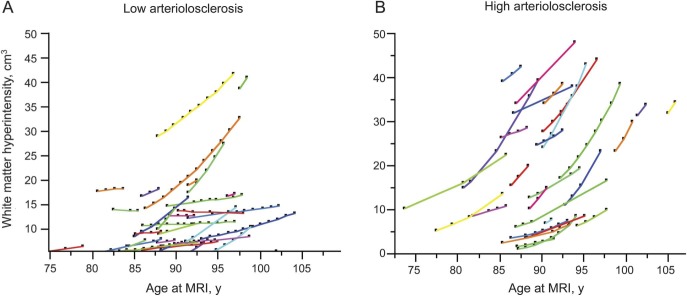
Figure. White matter hyperintensity accumulation over time by arteriolosclerosis group.
(A) Low arteriolosclerosis group. (B) High arteriolosclerosis group. The y-axis shows the white matter hyperintensity volume (numbers are predicted volumes obtained from the mixed-effects models) and the x-axis shows age.

