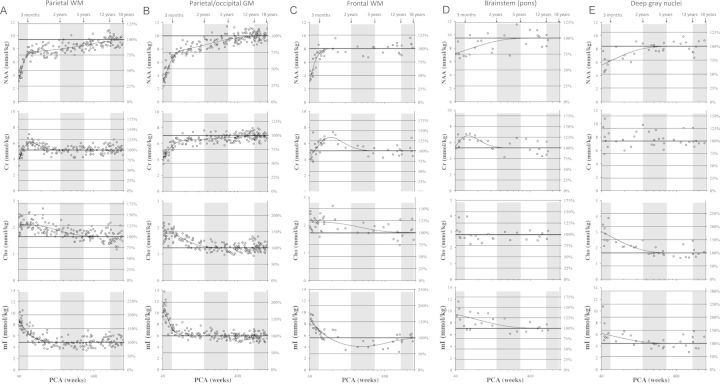
Figure 3.
Measured concentrations and fitted curves for NAA, creatine (Cr), total choline (Cho), and mI for the various brain regions studied versus age. A logarithmic scale was used for the time-axis (x-axis) to allow a more detailed inspection of age-dependent changes immediately after birth. PCA = postconceptional age.

