
Figure 3.
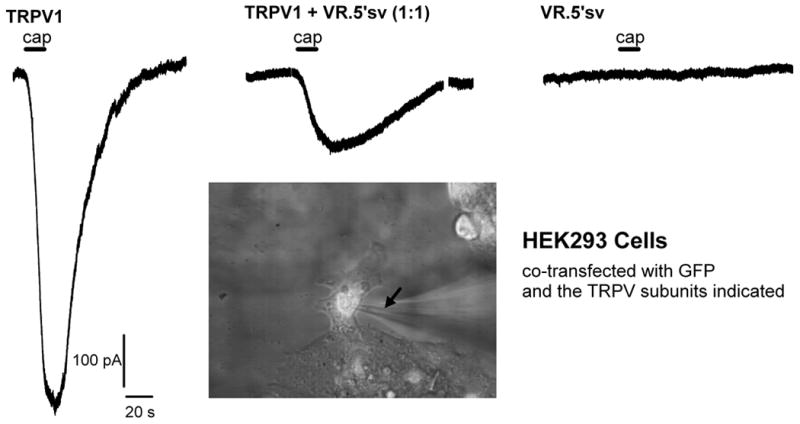
Whole cell inward current responses induced by capsaicin in HEK293 cells transfected with TRPV1 and VR.5’sv cDNAs or a combination of both cDNAs in equal amounts (0.8µg/coverslip/construct). From left to right the three traces are representative for recordings from cells expressing TRPV1 alone, TRPV1 and VR.5’sv (ratio 1:1), and VR.5’sv alone, respectively. Cells co-expressing TRPV1 and VR.5’sv show a greater than 70 % reduction in current response (1µmol/l capsaicin for 15 s). The application of capsaicin is indicated by bars above the traces (cap). The inset shows a microscopic image of a transfected cell during patch-clamp recording. The fluorescent signal from GFP expression can be appreciated in the cell indicating successful expression. The arrow points to the recording pipette on the cell. The recordings were obtained in voltage clamp mode in a whole cell patch clamp preparation. Solutions (in mmol/l: internal - KCl 140, MgCl2 1, EGTA 5, HEPES 5, and ATPNa2 5; external - NaCl 140, CaCl2 2, KCl 4, MgCl2, glucose 11, HEPES 5 and CsCl 3. The recording chamber was at room temperature (20-23°C) and continuously perfused with external solution (2 ml/min). Capsaicin was applied through a capillary, positioned 150 µm from cell. The holding potential was -60 mV.