
Figure 4.
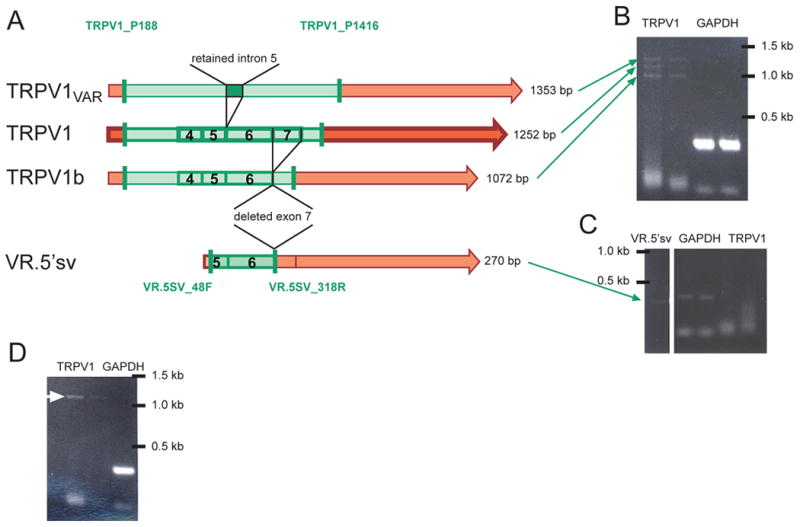
(A) Map illustrating the differences in organization of TRPV1 (center, darker color), TRPV1b and VR.5’sv (bottom), and TRPV1var (top) messages. TRPV1b skips exon 7 but is otherwise identical to TRPV1 whereas TRPV1var retains intron 5, as depicted above (exons 4-7 are indicated by boxes and numbers 4-7). VR.5’sv is missing the majority of the N-terminal intracellular region in addition to the polypeptide sequence associated with deletion of exon 7, also present in TRPV1b. It becomes clear that the four resulting PCR products (green shading) differ in size (length of product listed on right side). The three gel images (B-D) represent findings from single cell RT-PCR experiments and illustrate the presence of the different variants alone or in combination in different cells. The location of the primer pairs used to differentiate between the variants is indicated by the vertical green bars. (B) Three bands of the appropriate sizes were detected in the RT-PCR reaction from a single cell (left two lanes: TRPV1 primer pair, right lanes: GAPDH). (C) Another cell was negative for full length TRPV1 (right two lanes) but was positive for VR.5’sv (left lane, green arrow). The middle lanes show the GAPDH PCR product. (D) Single cell RT-PCR from this cell using the same primers as in (B) resulted in only one band, likely to be full length TRPV1 (white arrow). Double lanes represent different dilutions of product from first round PCR (left: 1:1000; right: 1:10,000) when added as template for second round PCR.