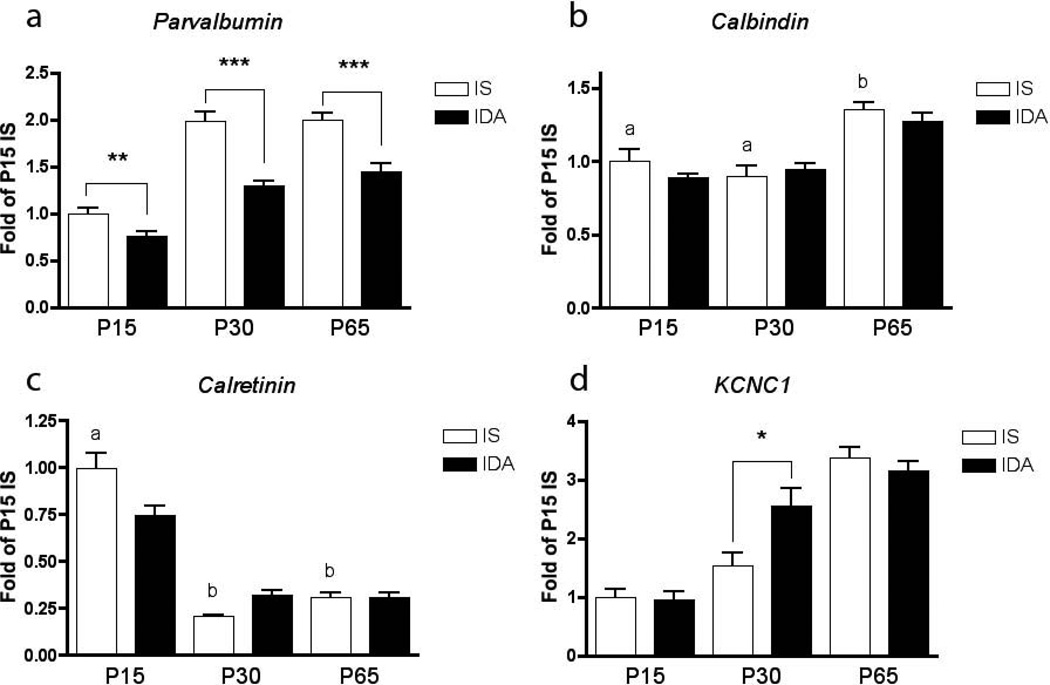
FIGURE 2.
Developmental ontogeny of a. parvalbumin b. calbindin c. calretinin and d. Kcnc1 mRNA expression (n=8 at each age and condition) in the rat hippocampus and the effect of fetal-neonatal IDA. For each time-curve, the P15 IS group is set at a relative expression of 1. a≠b≠c, * = p<0.05, ** = p< 0.01, *** = p< 0.001

