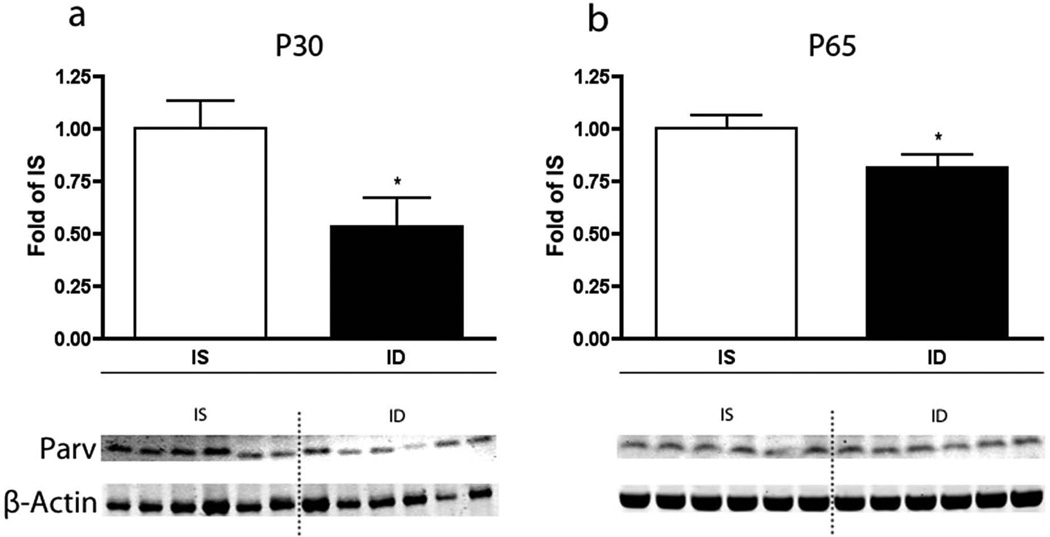
FIGURE 3.
Effect of fetal-neonatal IDA on parvalbumin protein levels at a. P30 and b. P65 (n=6 for each age and condition). White bars denote IS animals, and black bars denote the ID group. The IS groups are set at a relative expression value of 1. * = p <0.05. Representative Western blots are shown indicating parvalbumin protein expression and β-actin as the control protein.

