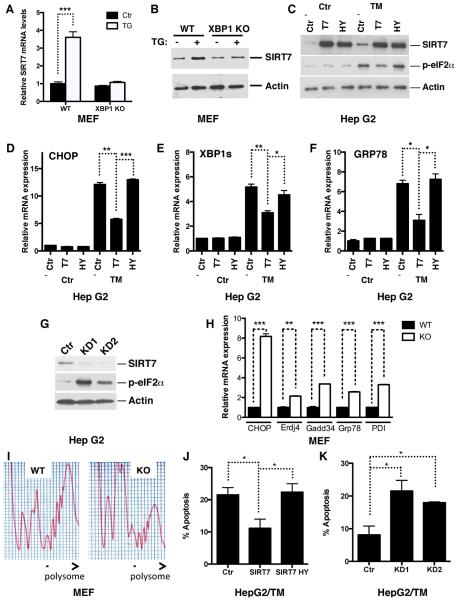
Figure 3. SIRT7 suppresses ER stress.
(A, B) Gene expression analysis by quantitative PCR (A) and western blotting (B) showing increased SIRT7 expression upon treatment of ER stress inducer thapsigargin (TG) in WT but not XBP1 KO MEFs.
(C–F) Western blots (C) and quantitative PCR (D–F) showing reduced ER stress in tunicamycin-treated stable HepG2 cells overexpressing (OE) WT but not catalytically inactive (H187Y) SIRT7, as indicated by eIF2α phosphorylation levels and ER stress response gene expression.
(G) Western blots showing increased ER stress in SIRT7 knockdown (KD) stable HepG2 cells.
(H, I) Increased ER stress in SIRT7 KO MEFs. Quantitative PCR showing increased expression of ER stress-induced genes in SIRT7 KO MEFs (H). Polysome profiling showing reduced polysome-to-monosome ratio, an ER stress marker indicative of translational initiation blockade (I).
(J, K) SIRT7 prevents ER stress-induced cell death. Stable SIRT7 overexpression (OE) or knockdown (KD1 or KD2) cells used in Figure 3C, G were treated with tunicamycin (2ug/ml for J and 1ug/ml for K) for 24 hours. Apoptosis was scored with Annexin V staining.
Error bars represent S. E. M. *: p<0.05. **: p<0.01. ***:p<0.001.
See also Figure S2.

