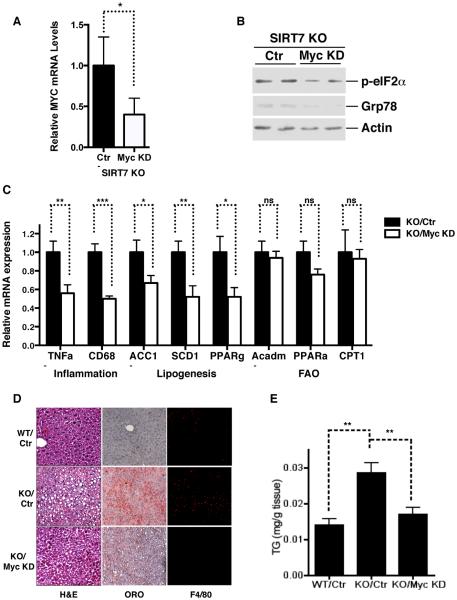
Figure 6. SIRT7 suppresses ER stress and prevents the development of fatty liver by repressing Myc.
Data shown are the comparison of WT, SIRT7 KO, and SIRT7 KO mice with Myc knockdown in livers via AAV8-mediated gene transfer.
(A) Myc expression by quantitative PCR.
(B) ER stress in the livers by western analysis.
(C) Quantitative PCR analysis for the expression of inflammation, lipogenesis, and fatty acid oxidation genes.
(D) H&E, oil red O staining, and F4/80 staining of liver sections.
(E) Liver triglyceride quantification.
n=5. Error bars represent S. E. M. *: p<0.05. **:p<0.01. ***:p<0.001. ns: p>0.05.
See also Figure S4.

