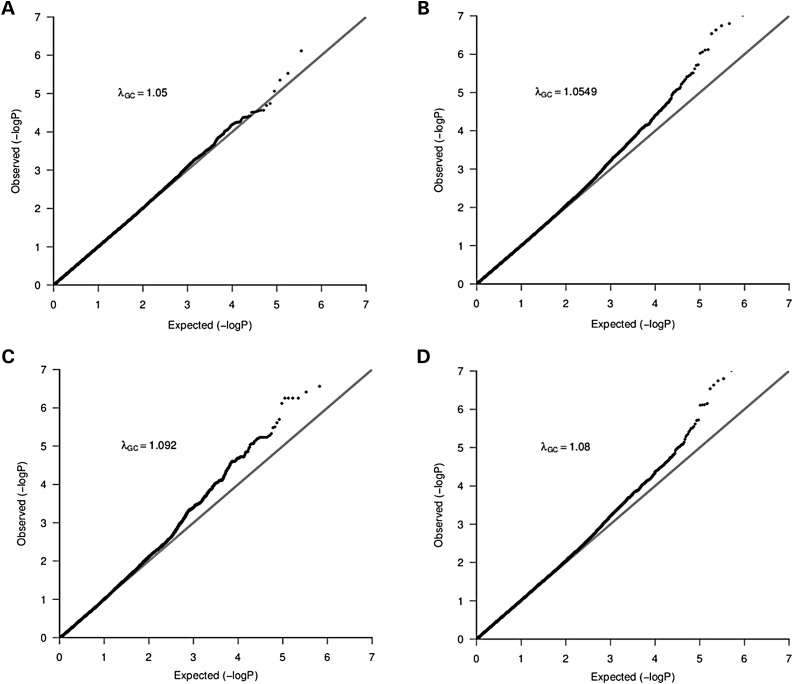
Figure 1.
Q–Q Plot of population stratification effects to compare the distribution of observed P-values with the expected distribution: The λGC values indicate the residual population stratification effects (after correction) which are minimal. Plots A–D are from typed genotype, imputed genotype from both HapMap3 and the 1000 Genomes project and combined datasets, respectively.

