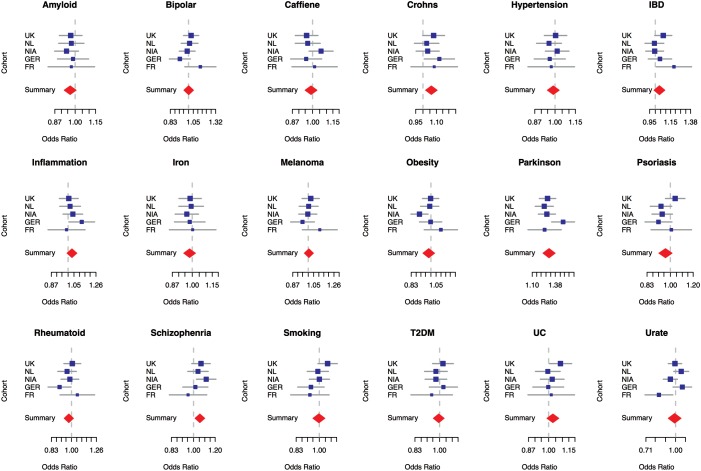
Figure 1.
Forest plots from random effects meta-analyses of profiled phenotypes. Cohort-specific OR associated with PD are shown in blue, the size of the square is proportional to the size of the study. Confidence intervals of the summary OR per phenotype are shown as red diamonds, with the centerline of each diamond representing the summary OR for that particular phenotype. The dependent variable in each model is the standardized count of disease risk or quantitative measure increasing alleles per sample associated with either disease status or continuous measures of interest. Abbreviations include Bipolar for bipolar disorder, IBD for inflammatory bowel disease, T2DM for type 2 diabetes, Crohn's for Crohn's disease, UC for ulcerative colitis, Parkinson's for Parkinson's disease, Rheumatoid for Rheumatoid arthritis, Smoking for smoking history/rate, Caffeine for caffeine or coffee consumption levels, amyloid for serum amyloid levels, iron for serum iron levels and urate for serum urate levels.

