
Figure 3.
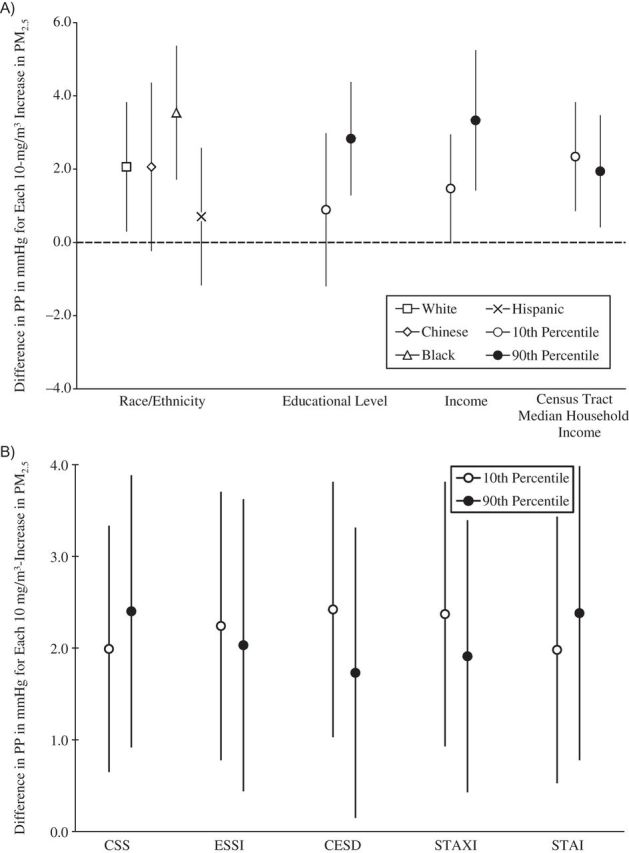
Associations between concentrations of particulate matter less than 2.5μm in aerodynamic diameter (PM2.5) and pulse pressure (PP), by social disadvantage and psychosocial level or category, Multi-Ethnic Study of Atherosclerosis, 2000–2002. A) Associations by social disadvantage level or category. B) Associations by psychosocial level. All socioeconomic measures were operationalized so that higher values represented a greater socioeconomic resource. All psychosocial measures were operationalized so that higher values represent greater adversity. The scale of the psychosocial measures is per 1 unit. Models were adjusted for age, sex, season, site, season-by-site interaction, antihypertensive medication use, apparent temperature, and all other socioeconomic and psychosocial variables in the figure. Results are the difference in PP per 10-μg/m3 increase in PM2.5 exposure averaged over the month prior to the examination. Income and census tract median household income values are per $10,000. CESD, Center for Epidemiologic Studies Depression Scale; CSS, Chronic Stress Scale; ESSI, Emotional Social Support Index (reverse-coded); STAI, Spielberger Trait Anxiety Inventory; STAXI, Spielberger Trait Anger Expression Inventory. Bars, 95% confidence intervals.