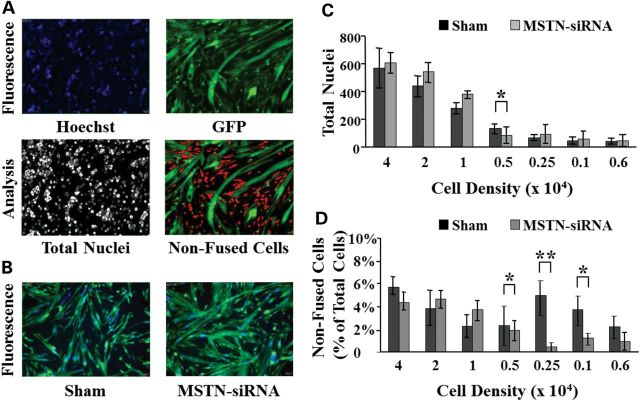
Figure 1.
Optimization of the screening protocol. (A) The MetaXpress imaging software allows us to determine the number of non-fused cells in each imaged field. Viable hoechst (33342) is used to visualize nuclei in the 355/360 nm wavelength spectrum and appears blue. GFP is imaged in the 485/520 nm spectrum to identify green fluorescent cytoplasmic content. Initially, the software analyzes each image separately to determine the total number of nuclei (hoechst staining). Green fluorescent cells are discriminated based on the size and shape. The imaging software distinguishes mononucleated (non-fused) cells from Mts containing two or more nuclei. (B) An siRNA targeting myostatin mRNA (MSTN-siRNA) was used as a positive control and to optimize the screening protocol. Note the difference in Mt size when compared with untransfected cells. (C) Mbs were seeded in 384-well plates at different concentrations and transfected with the MSTN-siRNA or transfection reagent alone (Sham) for 24 h. Cells were allowed to differentiate for 48 h in differentiation medium before acquiring the images. Each bar represents the average count of total number of nuclei per well (N = 16 wells). (D) Changes in the fusion index were measured 48 h after induction of differentiation in sham-transfected cells or cells transfected with the MSTN-siRNA. Fusion index was calculated as a percentage of cells containing two or more nuclei over total number of cells. (*P < 0.05; **P < 0.005).

