Fig. 1.
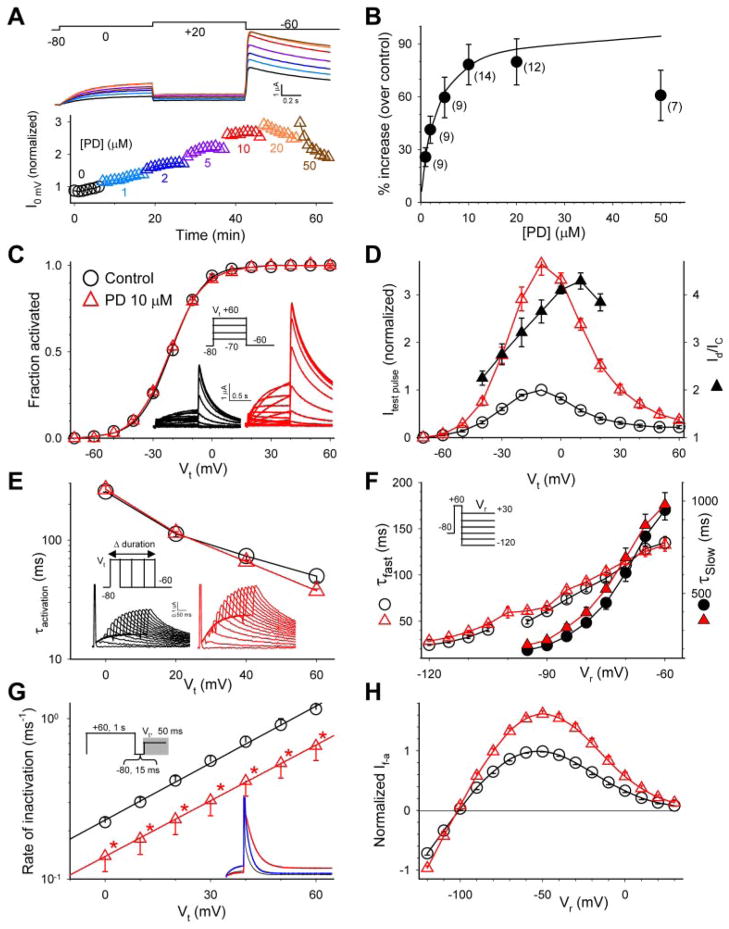
Characterization of the effects of PD on the hERG channel expressed in oocytes. A, top, superimposed hERG current traces before (black) and after PD application (1, 2, 5, 10, 20, and 50 μM, traces shown in the same colors as those of symbols in the lower panel). The currents were elicited by the voltage clamp protocol diagrammed on top applied once every min. Bottom, time course of changes in hERG current amplitude from the same experiment. Current amplitudes were measured from the time-dependent current during the 0 mV step and normalized by the control current right before the start of PD application. B, concentration-response relationship. Numbers of measurements are shown in parentheses. The superimposed curve was calculated from the equation Id/Ic = 1+ (A − 1)/(1 + Kd/[D]), with A (-fold increase in current amplitude) = 2 and apparent dissociation constant (Kd) =3 μM. In the following panels, data points and current traces recorded under the control conditions are shown in black, and those recorded in the presence of PD (10 μM) are shown in red. C, PD did not shift the 1-s isochronal activation curve of hERG. Inset, voltage-clamp protocol and representative current traces. The relationship between Vt and peak amplitude of tail current (Itail) was fit with a Boltzmann function: Itail = Imax/[1 + exp(V0.5 − Vt)/k], to estimate the maximal peak tail current amplitude (Imax), half-maximal activation voltage (V0.5) and slope factor (k). Itail was normalized by Imax (Itail/Imax = fraction activated) and plotted against Vt. D, PD increased hERG test pulse currents in a voltage-dependent manner. The voltage clamp protocol was the same as that described for C. For each oocyte, amplitudes of time-dependent currents during 1-s test pulses to Vt were normalized by the control current at Vt −10 mV. The current ratios, Id/Ic, are also plotted based on the right coordinate. E, PD did not alter the time course of hERG activation. Inset, “envelope” voltage clamp protocol and representative current traces. The rate of hERG activation was slower than inactivation. Thus the time course of activation could not be directly measured from the test pulse currents. Because the outward tail currents signified channels recovered from inactivation, the time course of growth of peak tail current amplitude after increasing durations of depolarizing pulses could be used to infer the time course of channel activation. The membrane voltage was stepped to Vt for durations varying from 5 to 1000 ms in 50-ms increments. The time course of growth of peak tail current amplitude was fit with a single exponential function to generate τactivation (plotted on a logarithmic scale so that the slope indicates the voltage-sensitivity of the underlying gating process). F, PD did not alter the time course of hERG deactivation. Inset, voltage-clamp protocol. Tail currents during 2- to 5-s step to Vr were fit with a double exponential function to generate the fast and slow time constants of deactivation (τfast and τslow, right and left coordinates, respectively). In Vr range ≤ − 100 mV, channel deactivation was almost exclusively the fast component; thus τslow values are not shown. G, PD modestly slowed the rate of hERG inactivation. Inset, triple-pulse voltage-clamp protocol and representative current traces during the third step (indicated by gray shade in the protocol diagram). The blue trace represents control current trace scaled to match the amplitude of current in PD. hERG inactivation was faster than activation. To bypass the slow activation process, the hERG channels were first fully activated and inactivated by a 1-s step to +60 mV. This was followed by a brief 15-ms step to −80 mV, during which the channels recovered from inactivation without appreciable deactivation. The third depolarizing step to various Vt caused channel transition from open to inactivated states. The decay of current traces during the third pulse was fit with a single exponential function to generate time constant of inactivation (τinactivation). The rate of inactivation (reciprocal of τinactivation, left coordinate, logarithmic scale) was plotted against Vt. The relationship between the rate of inactivation and Vt in the range of 0 to + 60 mV was fit with the equation K(Vt) = K(0)exp(zinaVtF/RT), where K(Vt) and K(0) are rates of inactivation at Vt and 0 mV, respectively; zina is the equivalent gating charge of inactivation; and F, R, and T are the Faraday constant, the gas constant, and absolute temperature, respectively. The lines superimposed on the data points were calculated from this equation, with K(0) and zina values of 0.23 ms −1and 0.72 for control, 0.12 ms−1 and 0.71 for PD. * p < 0.05, PD versus control. H, PD increased both outward and inward currents through the hERG channel. The voltage clamp protocol was the same as that diagrammed in F. For each cell, current amplitudes were measured from the peak or plateau level of tail currents (defined as fully activated current, or If-a) and normalized by the control If-a at −50 mV.

