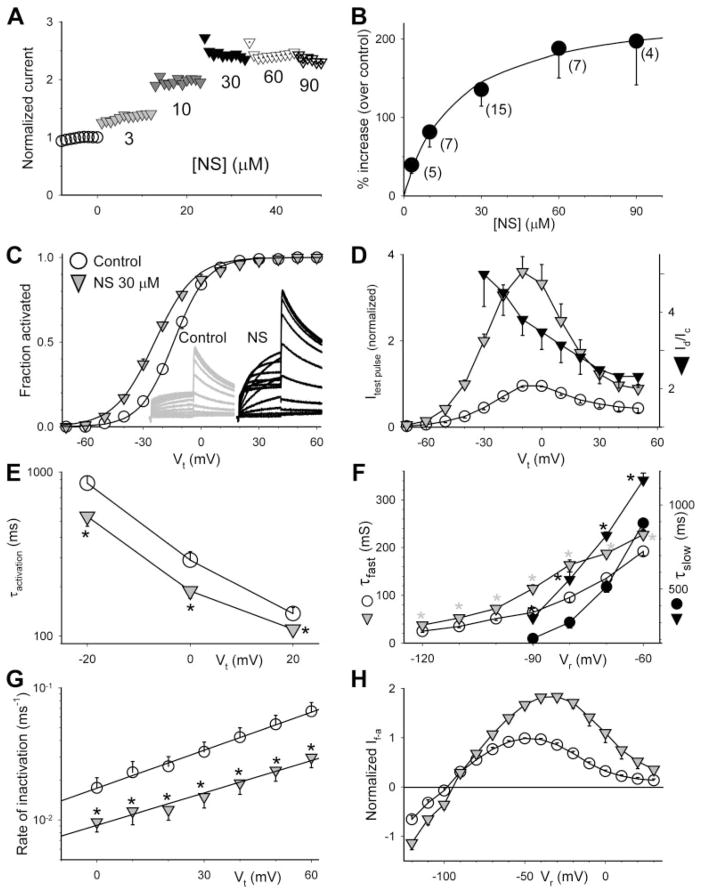
Fig. 2.
Characterization of the effects of NS on the hERG channel expressed in oocytes. Voltage clamp protocols and methods of data analysis are the same as those described for corresponding panels in Fig. 1. [NS] for experiments shown in C to H was 30 μM. A, time course of changes in hERG current amplitude before and during exposure to NS at the specified concentrations. B, concentration-response relationship. The superimposed curve was calculated from the equation Id/Ic =1+ (A − 1)/(1 + Kd/[D]) with A (-fold increase in current amplitude) = 3.24 and Kd = 20 μM. C, NS shifted the 1-s isochronal activation curve of hERG in the negative direction by −9.8 ± 1.4 mV (n = 7). D, NS increased hERG test pulse current in a voltage-dependent manner. E, NS accelerated hERG activation (shortened τactivation). F, NS slowed hERG deactivation, manifested as a prolongation of τfast and τslow. G, NS slowed hERG inactivation. The lines superimposed on the data points were calculated from K(Vt) = K(0)exp(zinaVtF/RT) (described for Fig. 1G), with values of K(0) and zina of 0.02 ms−1and 0.6 for control and 0.01 ms−1 and 0.5 for PD, respectively. H, NS increased both outward and inward currents through the hERG channel. * p < 0.05, NS versus control.

