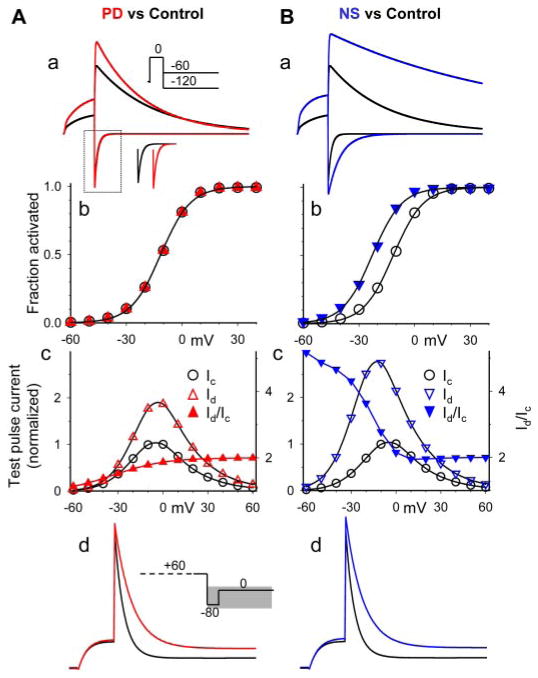
Fig. 3.
Model simulation of the effects of PD307243 (A) and NS1643 (B) on the hERG channel. The model and parameter values are listed in Table1. Simulated current traces and data points for control, PD and NS are shown in black, red and blue, respectively. For each column, a and d show superimposed simulated current traces elicited by the voltage clamp protocols diagrammed in the insets (time scale was the same as protocols shown in Fig. 1), b depicts simulated 1-s isochronal activation curves, and c illustrates simulated test pulse current-voltage relationship (open symbols, left coordinate) and current ratio (Id/Ic, right coordinate). Inset of A, a, shows horizontally shifted inward tail currents at −120 mV, to illustrate the difference in the peak current amplitude.

