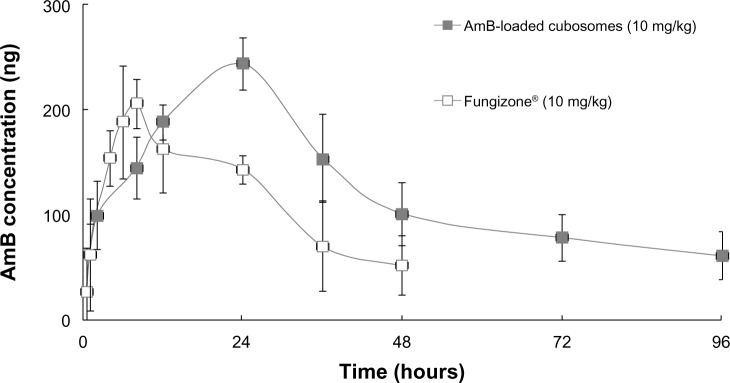
Figure 6.

Comparative in vivo plasma concentration versus time profiles, following a single, orally-administered dose.
Note: Each data point represents the mean ± standard deviation of six determinations.
Abbreviation: AmB, amphotericin B.

Comparative in vivo plasma concentration versus time profiles, following a single, orally-administered dose.
Note: Each data point represents the mean ± standard deviation of six determinations.
Abbreviation: AmB, amphotericin B.