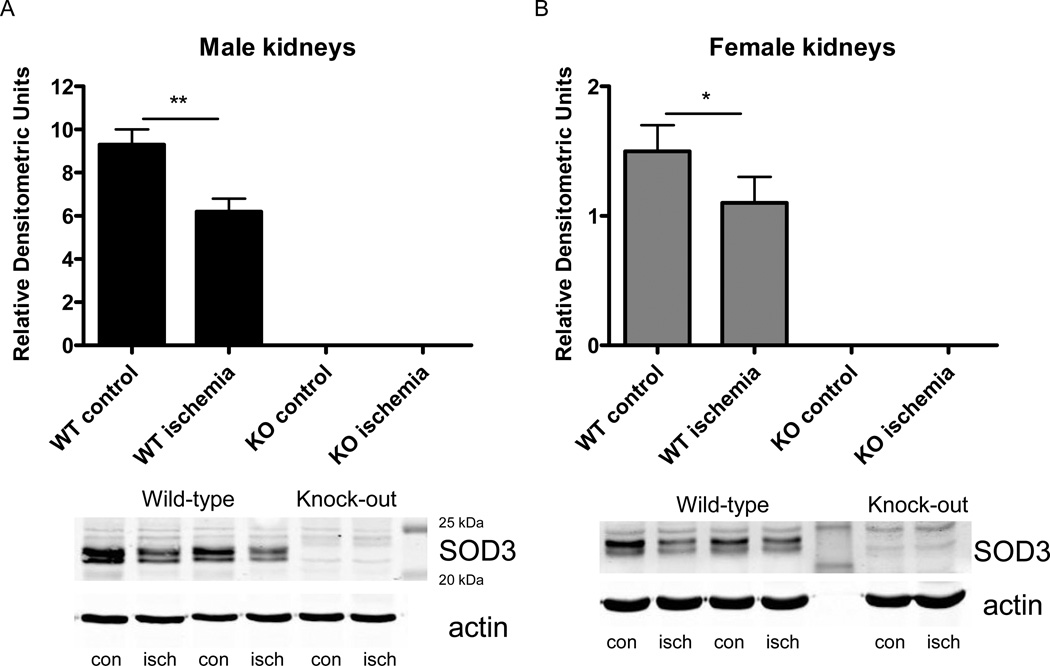
Figure 1. SOD3 expression in kidneys from male and female WT and SOD3−/− mice.
Expression of SOD3 in the cortex of paired control and post-ischemic kidneys after 1 hour of reperfusion of male (A) and female (B) WT and SOD3−/− mice (n=7 in WT males and n=7 in WT females, respectively). Bottom panel shows representative blot along with molecular weight standards. cont, control kidney; isch, ischemic kidney; * p<0.05, ** p<0.01.

