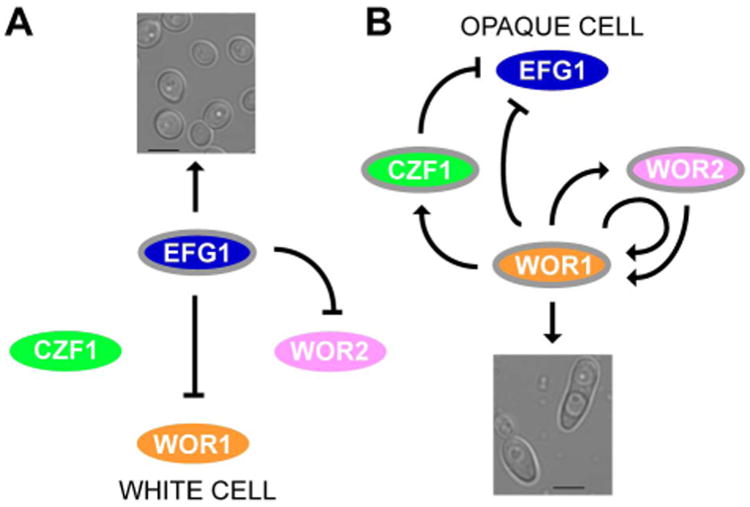
Figure 1.
Working model of the white-opaque regulatory circuit and its activity in the two cell types. (A) In white cells, Efg1 represses WOR1 directly as well as indirectly through WOR2 to maintain white cell identity. (B) In opaque cells, Wor1, Wor2, and Czf1 establish a series of positive feedback loops, maintaining opaque cell identity and repressing EFG1. Upregulated genes are bordered in gray and active relationships are indicated in black. Downregulated genes lack a border. Arrows and bars represent activation and repression respectively.

