Figure 5.
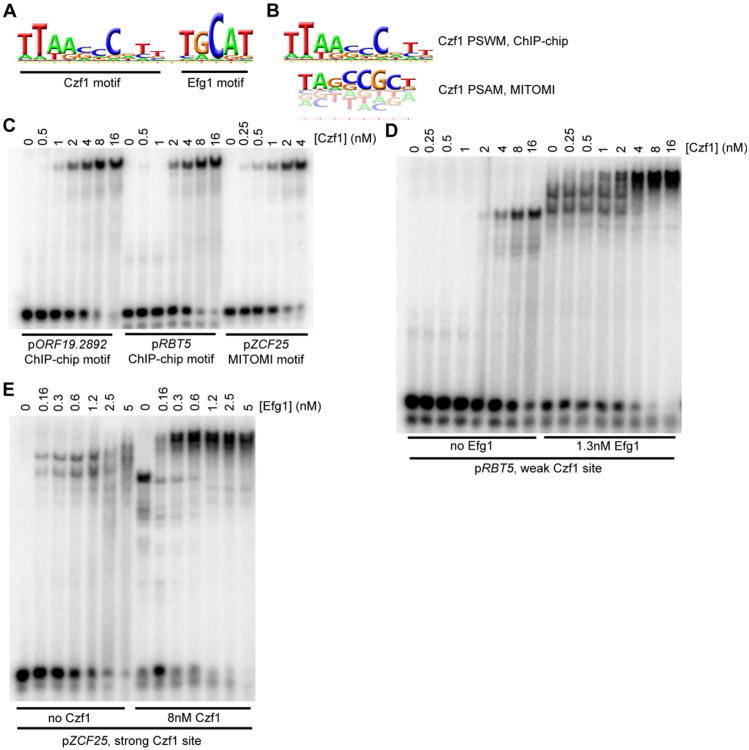
Further characterization of Czf1 and Efg1 binding sites. (A) Full PSWM for Czf1 developed from the white cell ChIP-chip data, including the Efg1 site (positions 12-16). (B) Comparison of ChIP-chip developed PSWM (top) and MITOMI 2.0 developed PSAM (bottom) for Czf1. (C) EMSAs for DNA fragments containing instances of the ChIP-chip motif (pORF19.2892, pRBT5) or the MITOMI 2.0 motif (pZCF25), performed using a 6×His-Czf1 construct. (D-E) EMSAs examining cooperative interactions between Czf1 and Efg1 at binding sites taken from either pRBT5 (D) or pZCF25 (E). Levels of one protein were increased stepwise (Czf1 in panel D, Efg1 in panel E) while the other protein was either absent or held at a fixed concentration (Efg1 in panel D, Czf1 in panel E).

