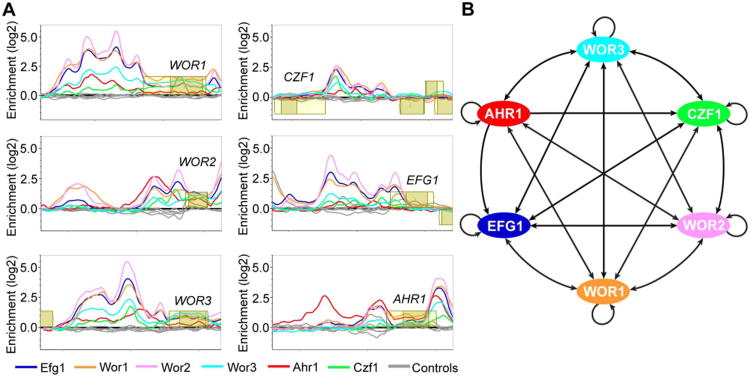
Figure 7.
ChIP-chip of the regulators of white-opaque switching and core regulatory network established in opaque cells. (A) ChIP-chip data for Ahr1 (red), Czf1 (green), Efg1 (blue), Wor1 (orange), Wor2 (pink), Wor3 (light blue), and their respective controls (grey) at the upstream regions for the six core regulators of white-opaque switching in opaque cells. Open reading frames are represented by yellow boxes, lighter yellow represents the untranslated region, genes above the bold line are transcribed in the sense direction and genes below the bold line are transcribed in the antisense direction. The x-axis represents ORF chromosomal locations and the y-axis represents the ChIP-chip enrichment value (log2). (B) Regulatory network in opaque cells, based on our ChIP-chip data as well as that from Zordan et al. (Zordan et al., 2007) and Lohse et al. (Lohse et al., 2013). Arrows represent direct binding interactions for the various transcriptional regulators.

