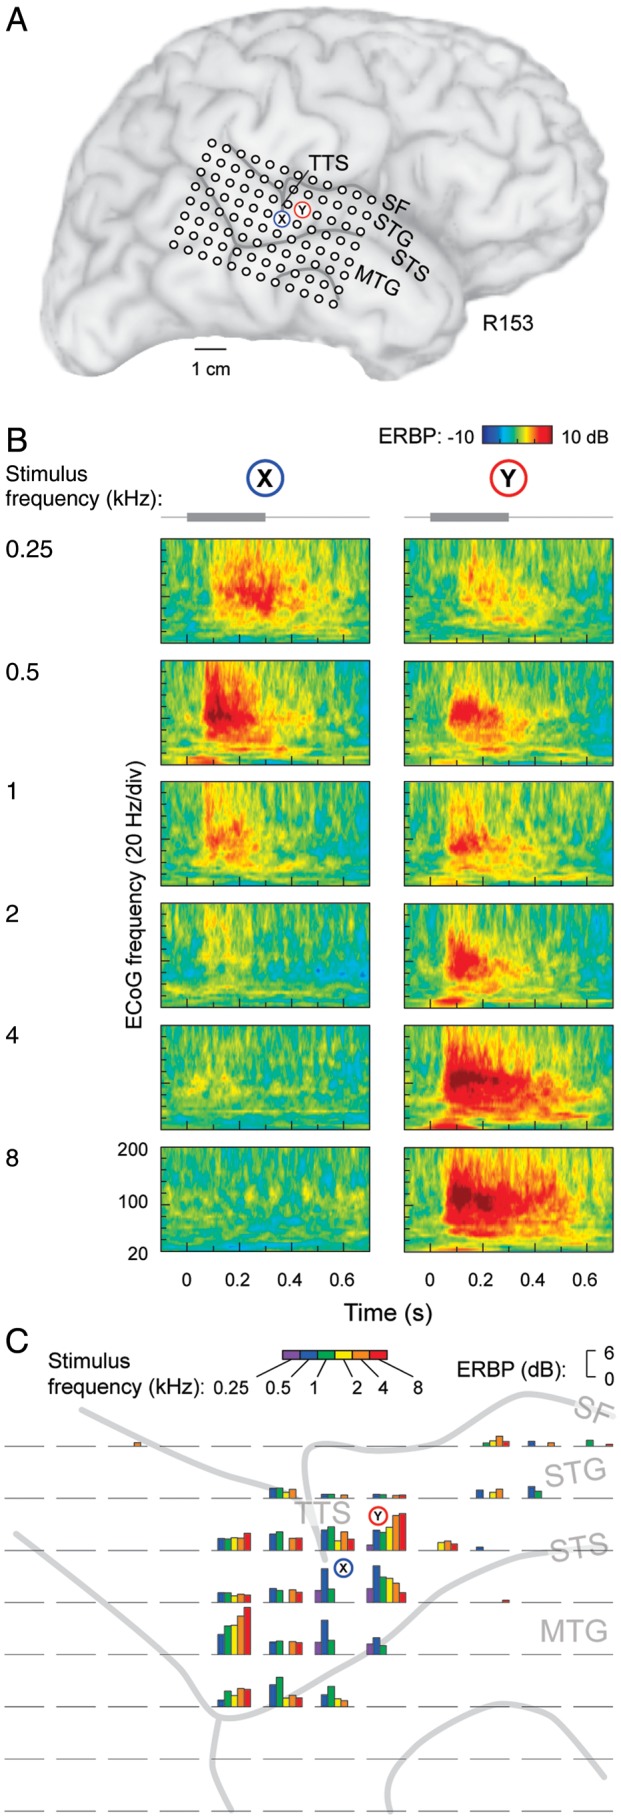
Figure 1.

Tone-elicited responses recorded from the lateral STG in a representative subject (R153). (A) Location of the 96-contact subdural electrode grid (TTS: transverse temporal sulcus; SF: Sylvian fissure; STG: superior temporal gyrus; STS: superior temporal sulcus; MTG: middle temporal gyrus). X and Y denote the locations of 2 sites those detailed response properties are shown in panel B. (B) Time–frequency analysis of cortical activity elicited by pure-tone stimuli between 0.25 and 8 kHz (top to bottom), recorded from 2 sites on the STG (left and right panels). Stimulus schematic is shown on top. ERBP was calculated relative to baseline power measured in the reference period between 100 and 200 ms prior to stimulus onset. (C) High gamma ERBP in response to tone stimuli presented at different frequencies (color bars), simultaneously recorded from the 96-contact grid (individual plots). High gamma band (75–150 Hz) ERBP was averaged within the time window of 100–150 ms after stimulus onset.
