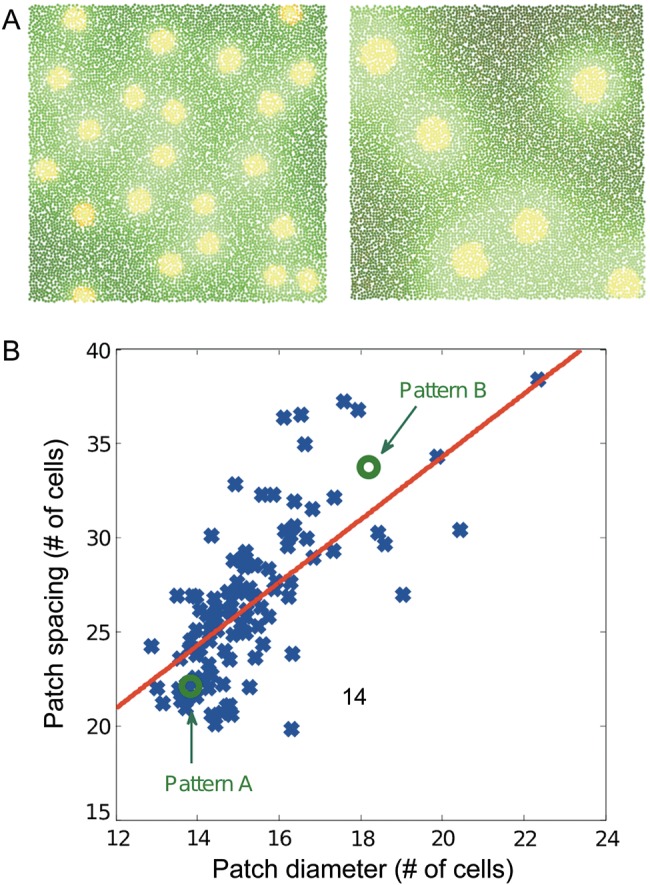
Figure 3.

(A) Two Gierer–Meinhardt patterns generated in Cx3D having different characteristic patch diameters and interpatch distances. The only difference between the 2 cases is the production coefficient: ρ = 600 for the left pattern and ρ = 35 for the right pattern. (B) Influence of the production coefficient ρ on the patch size and interpatch spacing. Each sample point (blue) indicates a separate simulation with different ρ. Average patch diameters and interpatch distances are linearly related. The equation of the fitted linear interpolation (red) is y = 1.72 x + 0.15 (R2 = 0.46, P-value <1 × 10⁻⁴), approximating closely the slope of 1.65 obtained from the experimental data (Muir et al. 2011). Note the increased density of sampling points toward the lower left, which has also been observed in biological systems.
