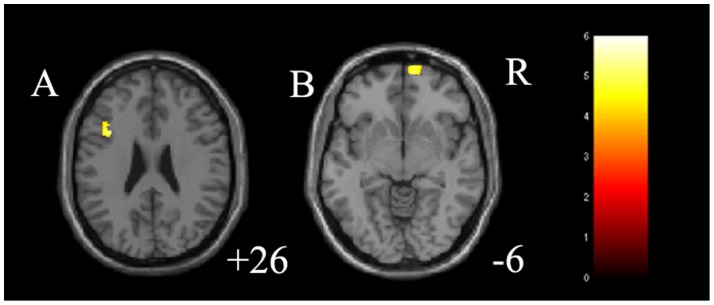
Figure 2. Regions of differences in gray matter volume in treated participants with major depressive disorder.

A: the axial image (z = 26 mm Montreal Neurological Institute coordinate plane) shows the regions of significantly increased gray matter volume in left thalamus in treated participants with major depressive disorder, compared to healthy controls (p<0.05, corrected). B: the axial image (z = −6 mm Montreal Neurological Institute coordinate plane) shows the regions of significantly increased gray matter volume in right orbitofrontal cortex in treated participants with major depressive disorder, compared to healthy controls (p<0.05, corrected). The color bar represents the range of T values. R = right.
