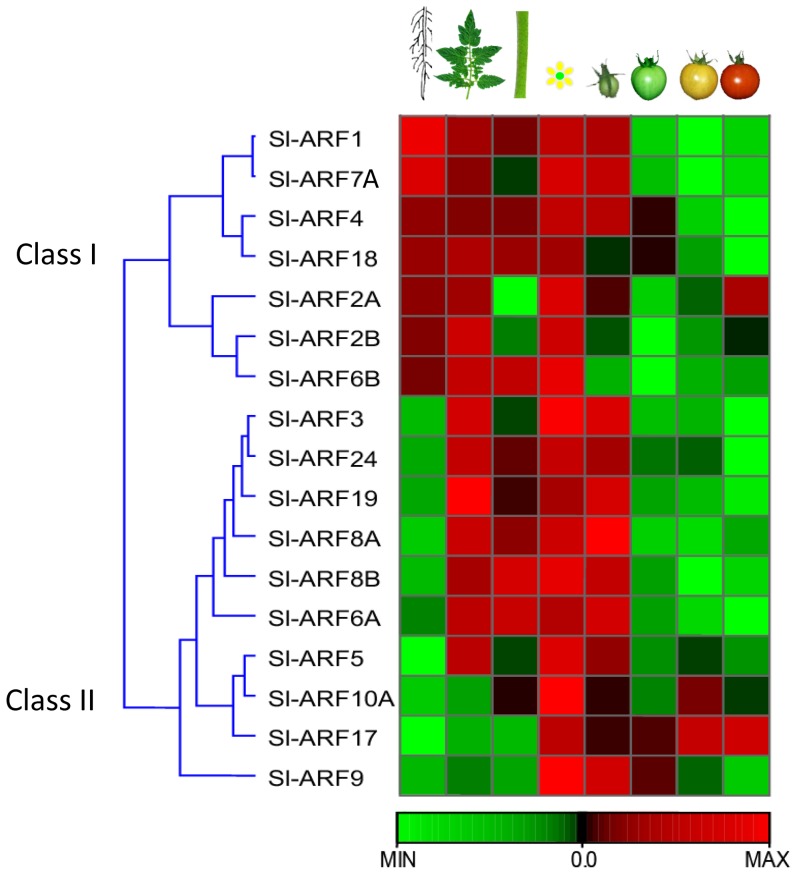
Figure 4. Heatmap showing Sl-ARF gene expression in different tomato tissues.
Changes in RNA accumulation in different tomato tissues (Roots, Leaves, Stems, Flowers, Early Immature Green (8 DPA), Mature Green, Breaker, Red (Breaker + 7 days) as schematically depicted above the displayed array data, are shown relative to the RNA accumulation levels in roots. Levels of down expression (green) or up expression (red) are shown on a log2 scale from the high to the low expression of each Sl-ARF gene.

