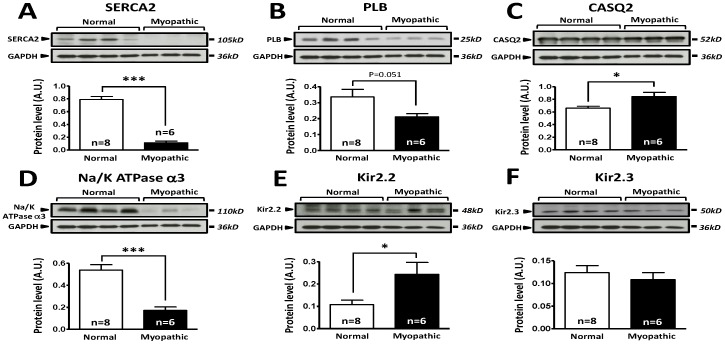
Figure 5. Comparison of protein expression in LV sample from control and cardiomyopathic patients.
A: Top; representative SERCA2 and respective GAPDH stainings obtained in normal and cardiomyopathic LV samples. Bottom; Mean±SEM, *** P<0.001. B: Top; representative phospholamban (PLB) and respective GAPDH stainings obtained in normal and cardiomyopathic LV samples. Bottom; Mean±SEM, P = 0.051. C: Top; representative calsequestrin 2 (CSQ) and respective GAPDH stainings obtained in normal and cardiomyopathic LV samples. Bottom; Mean±SEM, * P<0.05. D: Top; representative Na/K-ATPase-α3 and respective GAPDH stainings obtained in normal and cardiomyopathic LV samples. Bottom; Mean±SEM, *** P<0.001. E: Top; representative Kir2.2 and respective GAPDH stainings obtained in normal and cardiomyopathic LV samples. Bottom; Mean±SEM, * P<0.05. F: Top; representative Kir2.3 and respective GAPDH stainings obtained in normal and cardiomyopathic LV samples. Bottom; Mean±SEM. n = 8 control LV samples, n = 6 cardiomyopathic LV samples.

