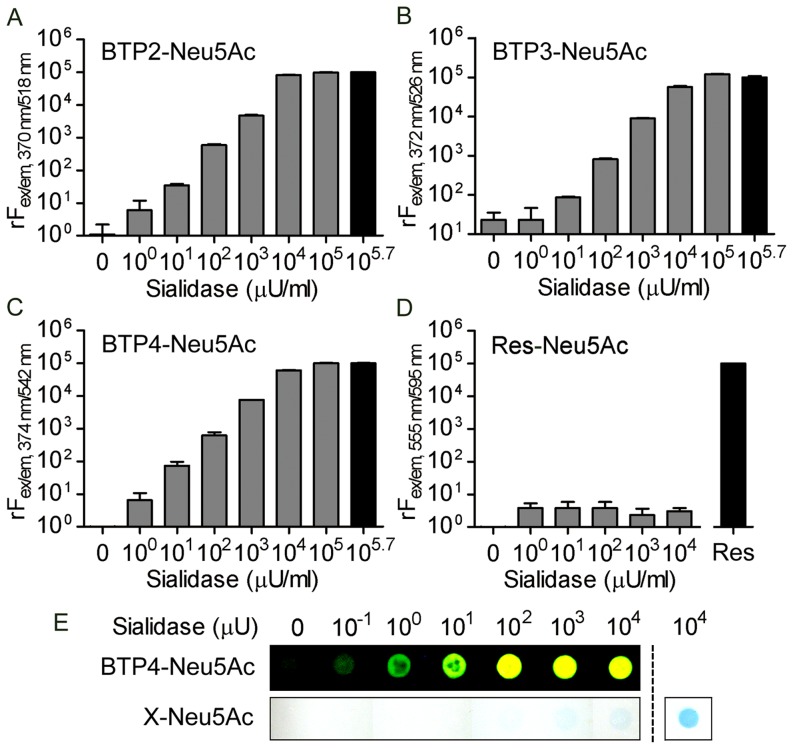
Figure 3. Hydrolysis of BTP-Neu5Ac with bacterial sialidase.
A–D, Relative fluorescence intensities proportionally increased with increasing amounts of AUSA in 10 µM BTP2-Neu5Ac (A), BTP3-Neu5Ac (B) and BTP4-Neu5Ac (C) but not in 10 µM Res-Neu5Ac (D). Each bar and line represent the mean ± S.E.M. (n = 3). The fluorescence intensities of each black bar were set to 105. Res: 10 µM resorufin. E, AUSA blotted on PVDF membranes was stained with 10 µM BTP4-Neu5Ac or X-Neu5Ac. The PVDF membranes were observed under UV light for BTP4-Neu5Ac or visible light for X-Neu5Ac. The blue color caused by staining of AUSA with 100 µM X-Neu5Ac is shown at the right of the dotted line.

