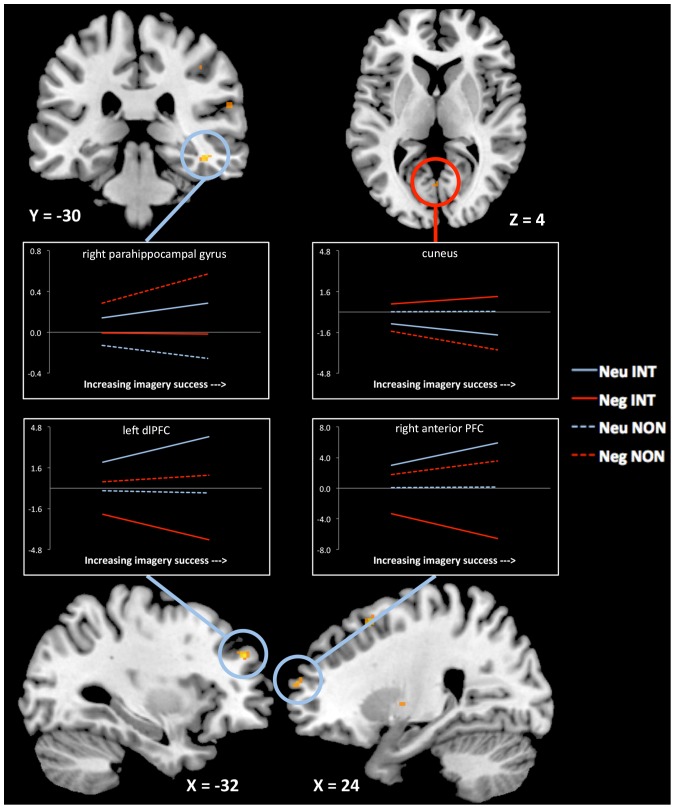
Figure 2. Regions that show significant parametric increase during encoding as a function of successful integration.
Right PHG (44 −30 −16), left dorsolateral PFC (−32 46 30), and right anterior PFC (24 62 16) all show selective parametric increase during neutral integration. The reversed interaction reveals that cuneus (0 −66 4) shows selective parametric increase during negative integration. Lines represent beta weights (slope) for the parametric relation, extracted from the peak voxel within each cluster. Dashed lines represent weights from the non-integrative condition and solid lines represent weights from the integrative condition. † = full interaction is significant at P uncorrected<0.005; * = full interaction is significant at P corrected<0.05; ** = pairwise comparison (e.g., neutral integration>negative integration) is significant at P corrected<0.05.

