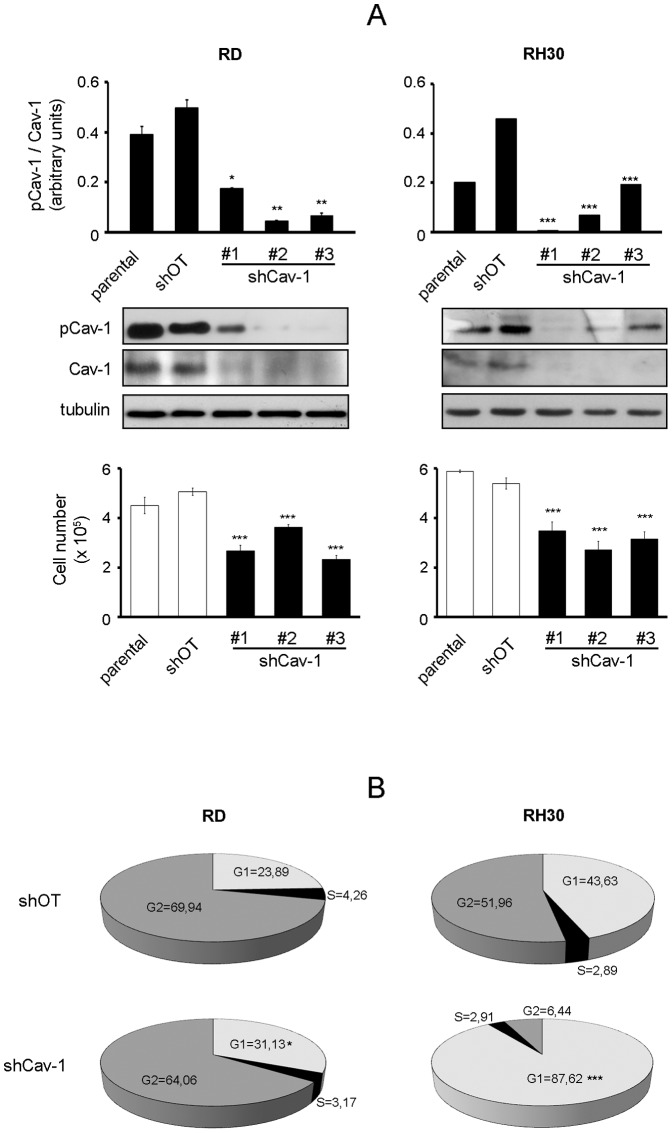
Figure 3. Effects of Cav-1 knockdown on cell proliferation.
RD and RH30 cells were stably transfected with either Cav-1 knockdown (shCav-1) or off-target (shOT) construct. A) Parental cells and selected clones were seeded in 60-mm dishes (at a density of 12×104). After 48 hours, cells were harvested and protein homogenates western blotted for pCav-1, Cav-1 and tubulin. Protein bands were quantified by densitometry after normalization with respect to tubulin (n = 3). *, P<0.05; **, P<0.001; ***, P<0.0001. At the same time points, cell proliferation was evaluated with Burker chamber, as shown in the bottom graphs. Bar graphs represent means ± SD of total cell numbers (n = 3). ***, P<0.0001. B) FACS analysis was performed on shCav-1 and shOT cells. Numbers in pie charts denote percent cells in the G1/S/G2-phases of the cell cycle (n = 3). *, P<0.05; ***, P<0.0001.

