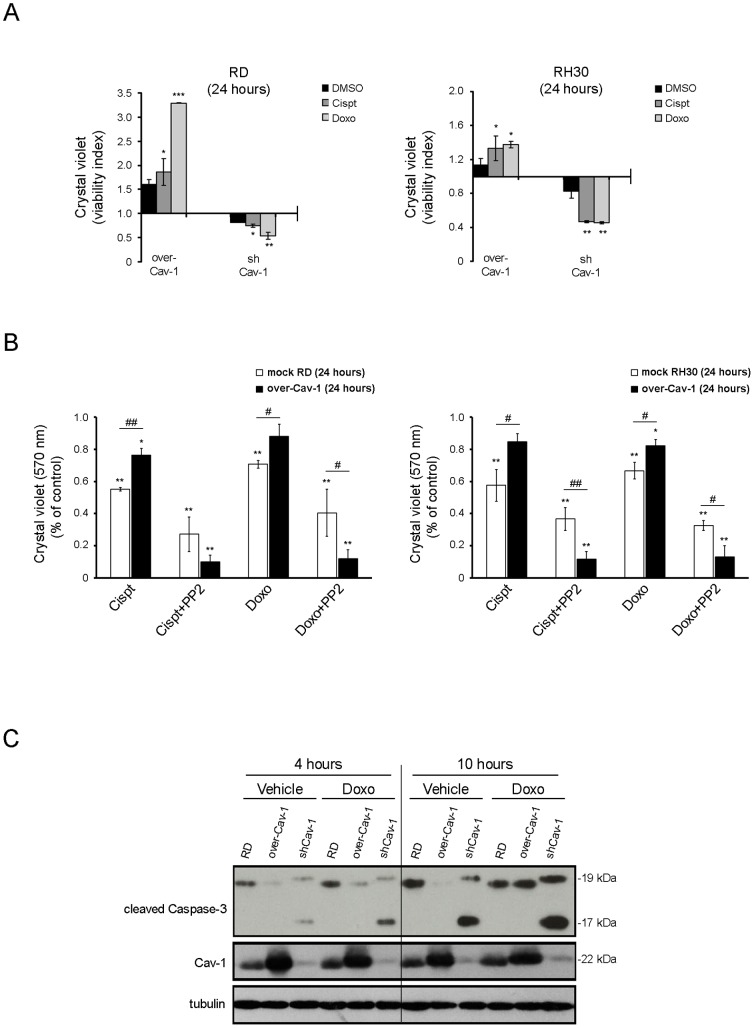
Figure 7. Effects of Cav-1 levels on chemoresistance in vitro.
A) Cells were seeded into a 24 well plate (at a density of 15×103). After 24 hours, cells were treated with cisplatin (0.2 ng/ml) or doxorubicin (2 µg/ml) and DMSO as control for up to 24 hours. Crystal violet assay was then performed and the viability index was calculated by dividing the mean number of viable cells in Cav-1 overexpressing or silenced clones through their respective controls Histograms represent means ± SD of absorbance (n = 4). B) Cristal violet assay was carried out to evaluate the percentage of viable Cav-1 overexpressing and control cells after treatment with either cisplatin or doxorubicin in the absence or presence of 10 µM PP2 for 24 hours. Histograms represent means ± SD of absorbance (n = 4). *, P<0.05; **, P<0.001; **, P<0.0001 versus untreated cells. #, P<0.05; ##, P<0.001. C) Cleavage of Caspase-3 was evaluated by western blot analysis in over-Cav-1, shCav-1 RD clones and parental cells treated or not with doxorubicin for the indicated time points.

