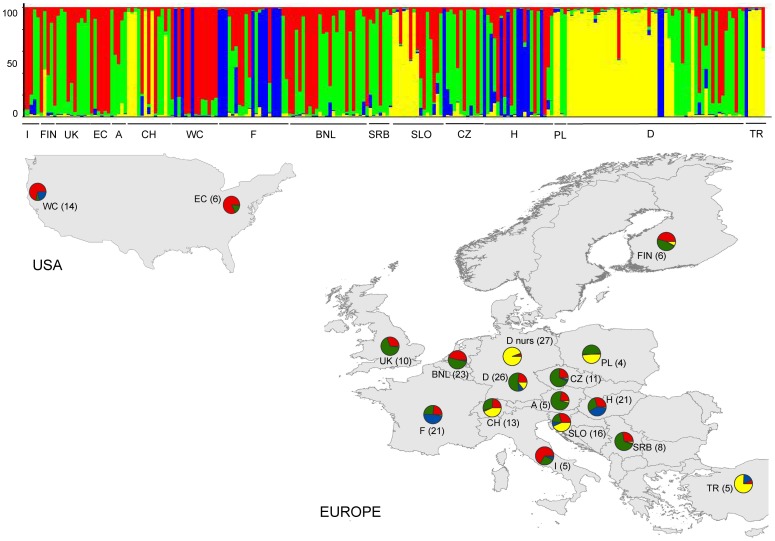
Figure 1. Population clustering of Phytophthora plurivora.
Genetic clustering (K = 4) of the 16 populations (N = 221 isolates) using 11 microsatellite markers. Each bar represents an individual isolate and colors code the proportion of membership to each cluster. The assignment probability is indicated on the left hand side. Populations are abbreviated as follows (left to right in the bar plot): Italy (I), Finland (FIN), United Kingdom (UK), US East Coast (EC), Austria (A), Switzerland (CH), US West Coast (WC), France (F), Belgium and Netherlands (BNL), Serbia (SRB), Slovenia (SLO), Czech Republic (CZ), Hungary (H), Poland (PL), Germany (D, D nurs), Turkey (TR). D nurs indicates isolates derived from German nurseries only, D all other isolates. Pie charts depict the genetic membership (q-mean) per population, in parentheses the number of isolates = multilocus genotypes per population.

