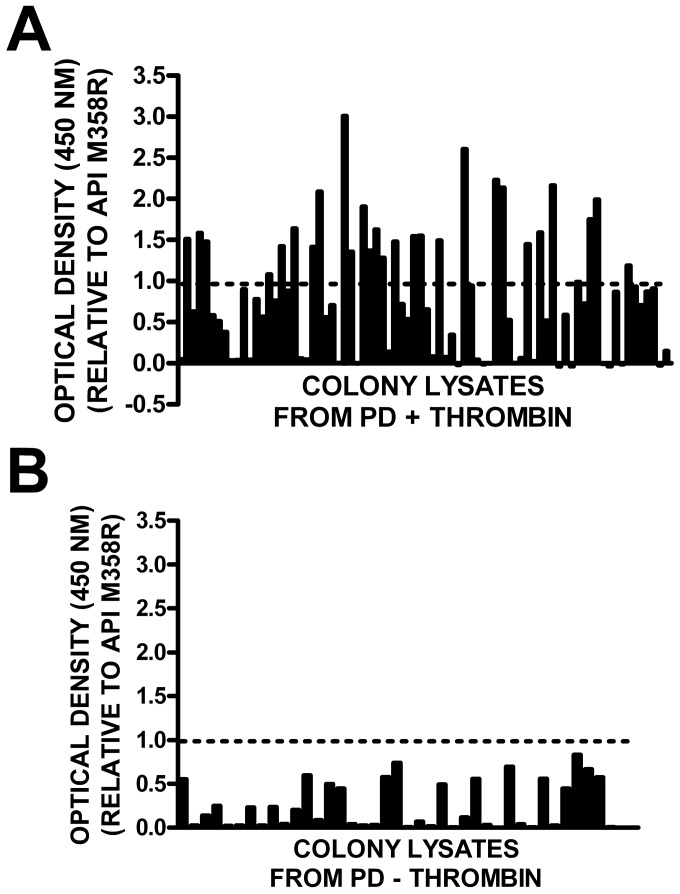
Figure 5. Relative binding of API P7–P3 variants in bacterial lysates.
Panel A: Thrombin-selected API RCL inserts from round 5 of phage display were transferred en masse to a plasmid expression library and bacteria were transformed. Eighty colonies were screened by the thrombin capture assay (as shown in Fig. 4B) and the resulting optical density values were normalized to API M358R lysate controls. The mean of two determinations is shown. Panel B: Same as panel A, except that the source of the plasmid expression library was round 5 of mock selection. The horizontal line in both panels highlights the relative optical density ratio of API M358R in the normalized results (y = 1.0).

