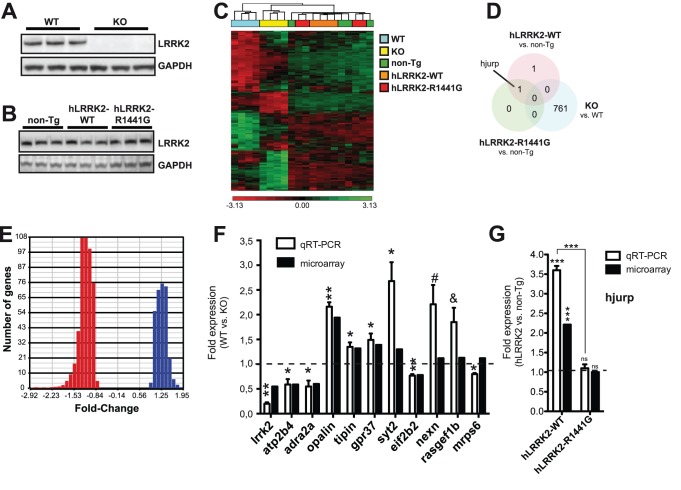
Figure 1. Gene microarray analysis of LRRK2 mice.
(A) Representative western blot of endogenous striatal LRRK2 in 4 month-old wildtype and knockout mice. GAPDH was used as a loading control. Three samples (mice) are shown in each group. (B) Representative western blot of striatal LRRK2 in 4 month-old non-Tg, hLRRK2-WT and hLRRK2-R1441G transgenic mice. GAPDH was used as normalization control. Three samples (mice) are shown in each group. (C) Cluster analysis of significantly (FDR<0.2) misregulated genes (mRNA transcripts) in various LRRK2 mouse models. Note that both WT and KO mice cluster together. This is not the case for non-Tg and hLRRK2-R1441G mice. Results were generated using Partek Genomics Suite. (D) Venn diagram showing no overlap between significantly (FDR<0.2) misregulated genes in LRRK2 mice. One gene, hjurp, was specifically upregulated in hLRRK2-WT mice. (E) Histogram showing that >99% of misregulated transcripts has less than 2-fold difference in expression in LRKK2 KO mice when compared to littermate controls. (F, G) Validation of genes by real-time qRT-PCR. Statistical significance was determined by a Student unpaired t test (* = p<0.05, ** = p<0.01, *** = p<0.001, # p = 0.063, & p = 0.0566). Standard error of the mean (SEM) is shown.

