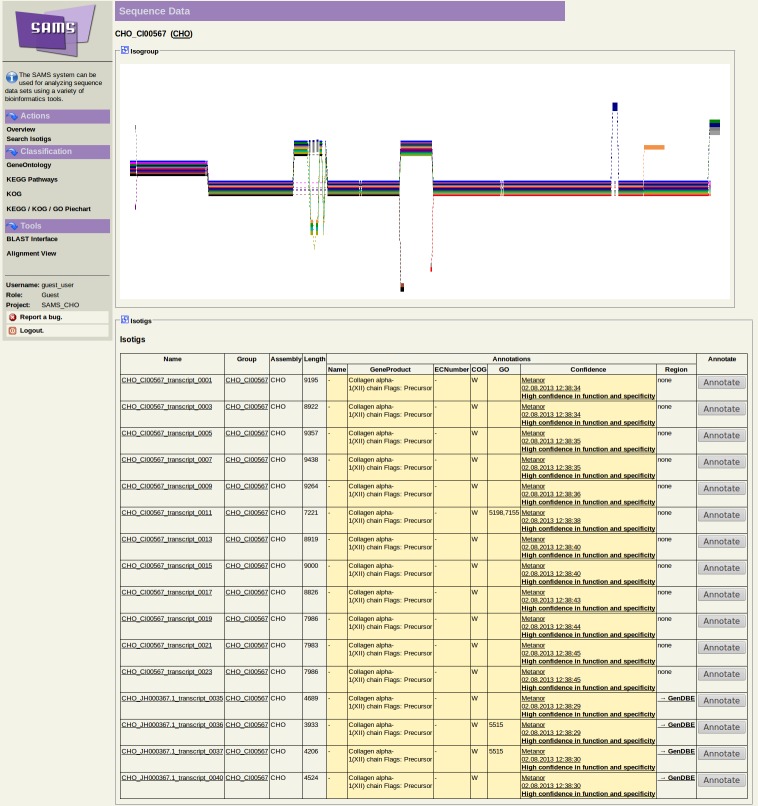
Figure 11. Screenshot of the SAMS web-interface showing a single transcript cluster.
The upper half of the interface shows a graphical representation of a possible splicing-graph of the cluster. The lower part lists all transcripts of the cluster with some information about the functional annotation of the transcript. Links to browse the database are on the left side of the interface.

