
Figure 1. Hepatic mRNA expression levels of Hsd11b1.
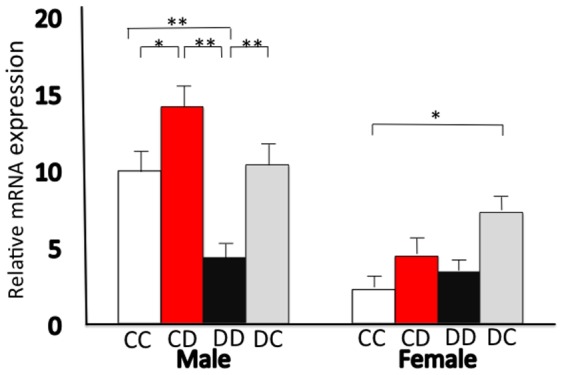
After delivery, foster mothers fed the same or different diets: CC, DD, CD, and DC (first letter: diet of original mother; second letter: diet of nursing mother). Data are represented as the means ± standard error. Statistically significant differences among the groups were determined with two-way analysis of variance (ANOVA), with diet and sex as the main factors. If interactions were found, the data were split and analyzed with one-way ANOVA. *P<0.05, **P<0.01.