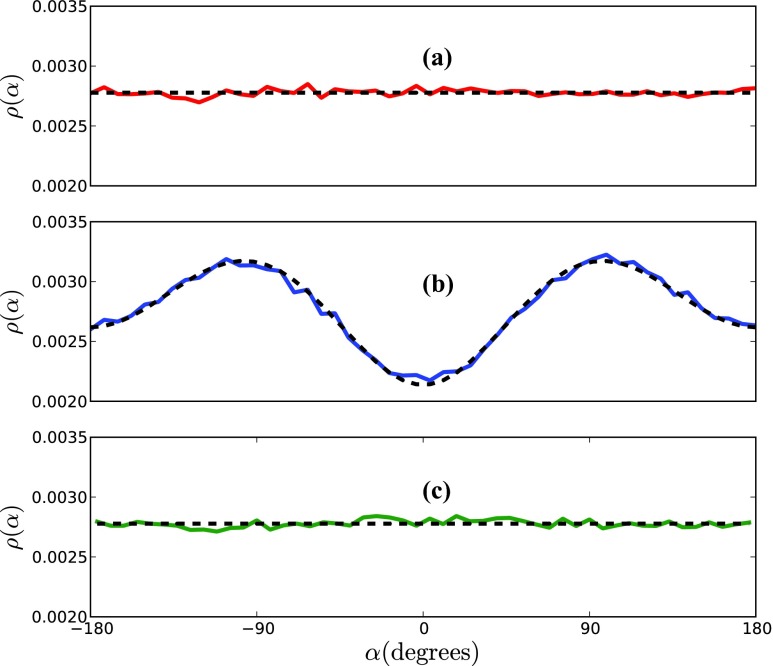
Figure 3.
Torsion angle distributions for the three-bond C4 chain, for (a) FLEXIBLE, (b) TORSIONAL, and (c) FIXMAN simulations. The dashed lines represent the predicted distributions, with the ones in (a) and (c) being uniform pdfs from Eq. 8, and the one in (b) from Eq. 25. The bin size for the histograms is dα = 7.2°.

