
Figure 7.
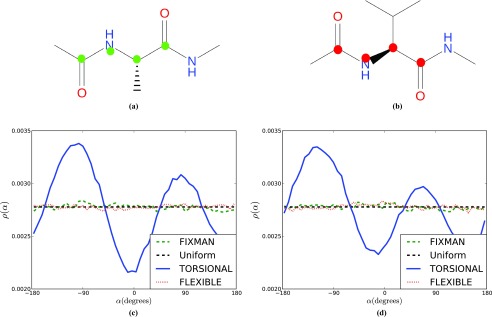
Structures of (a) alanine dipeptide and (b) valine dipeptide. The atoms highlighted with the green circles in (a) and the red circles in (b) constitute the torsion in the respective systems. Probability distributions for these torsions for alanine dipeptide and valine dipeptide, respectively, in (c) and (d). The application of the Fixman potential in the TORSIONAL model recovers the uniform pdf observed for the FLEXIBLE model. The bin size for the histograms is dα = 7.2°.