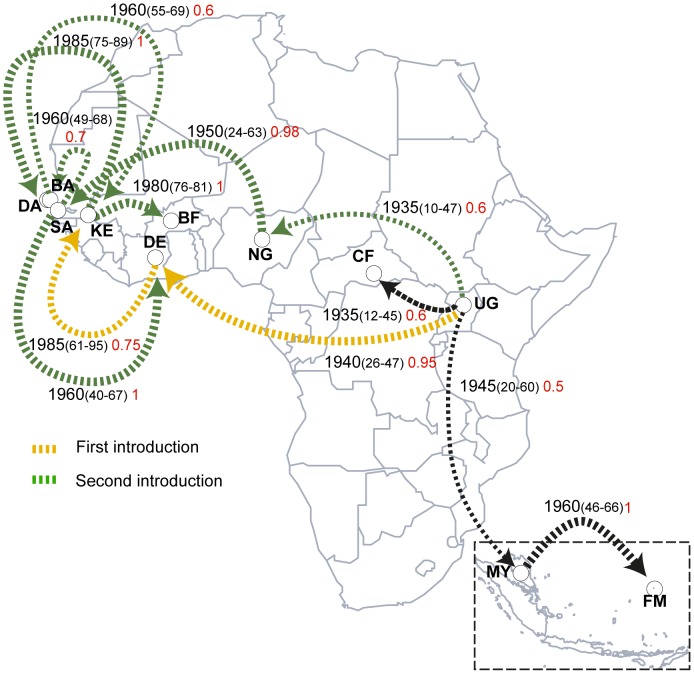
Figure 2. Geographic spread of ZIKV in Africa and Asia.
The directed lines connect the most probable sources and target localities of viral lineages (shown by arrows), with widths proportional to the posterior probabilities and values shown in red. Only plausible routes with probabilities above 50% are shown. The distinct introductions into Senegal and Côte d'Ivoire were represented by different colors. The estimated time to the most recent common ancestor of strains from different countries are shown with 95% posterior time intervals in parenthesis and could be interpreted as the oldest possible year of introduction of that lineage at that locality.

