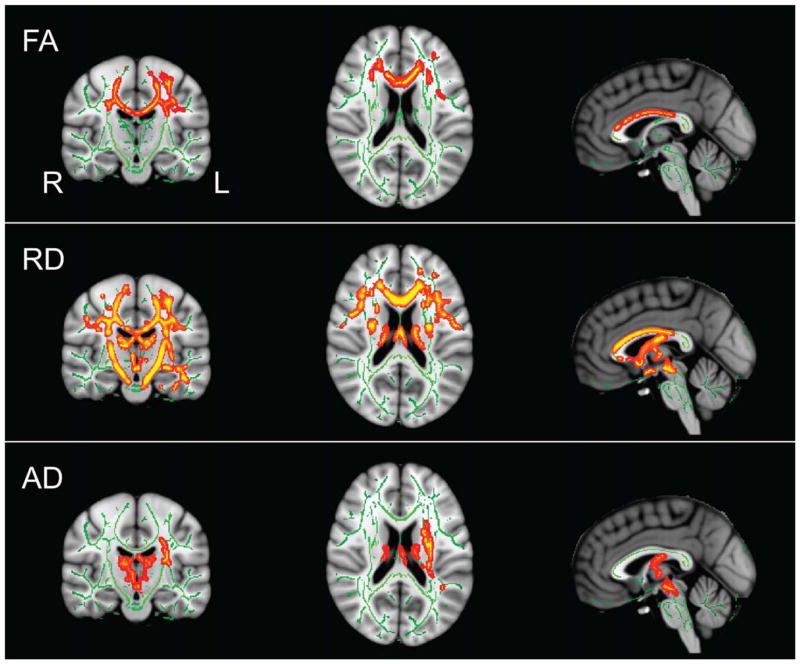
Figure 1.
DTI TBSS P value maps fully corrected for multiple comparisons of voxel-wise differences between patients and healthy controls for FA, RD, and AD. Results displayed at significant levels (P <0.05, fully corrected for multiple comparisons) in Montreal Neurological Institute (MNI) standard space overlaid on the mean FA image derived from all participants. Major fiber tracts as determined by TBSS are displayed in green. Red-yellow clusters indicate locations of significant corrected differences between patients and controls (P <0.05). Locations of images in standard space are X = −1, Y = −17, Z = 19, MNI mm.

