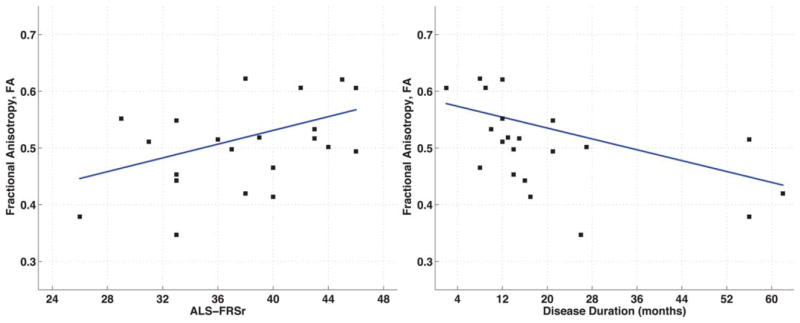
Figure 3.

Scatterplots showing significant partial correlations between mean FA in Area III of the CC and ALSFRS-r scores when correcting for age (r = 0.457, P = 0.043) and months since symptom onset when correcting for age (r = −0.524; P = 0.018). [Color figure can be viewed in the online issue, which is available at wileyonlinelibrary.com.]
