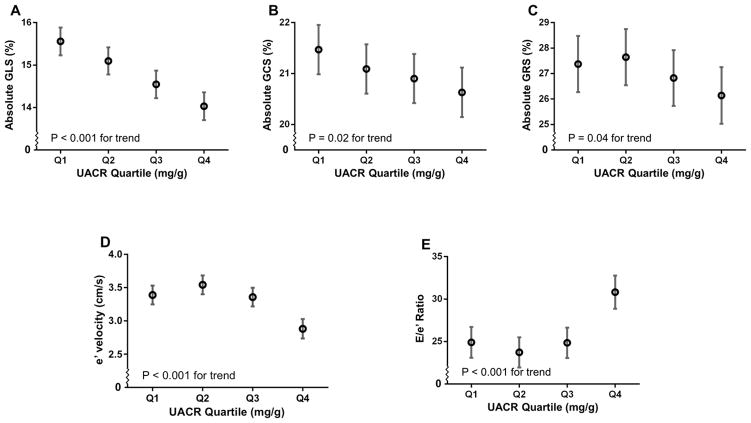
Figure 1.
Cardiac Indices by UACR Quartile. Estimated means and 95% confidence intervals for (A) global longitudinal strain; (B) global circumferential strain; (C) global radial strain; (D) early diastolic (e′) tissue velocity; and E/e′ by UACR quartile, adjusted only for relatedness among participants. P for trend indicates significance of association between log-transformed UACR and cardiac indices in linear mixed effects models (which accounts for relatedness among participants). Tissue velocities by speckle tracking are lower than values observed using tissue Doppler. Thus e′ tissue velocity is lower and E/e′ is higher than observed with tissue Doppler imaging.

