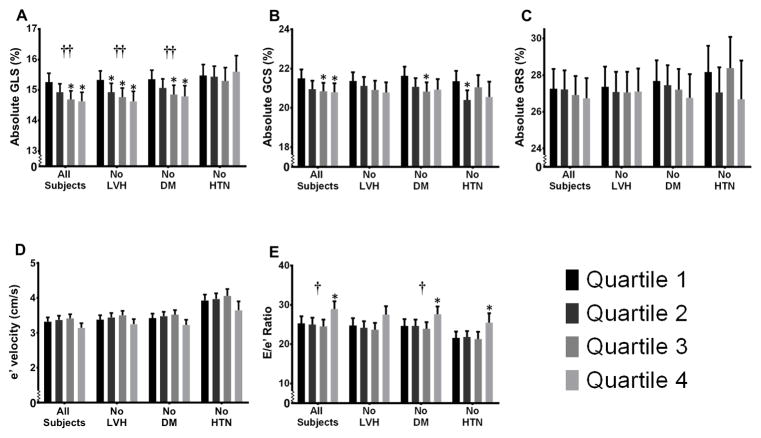
Figure 2.
Cardiac Indices by UACR Quartile After Multivariable Adjustment. *P-value < 0.05 when compared to the referent quartile (Quartile 1). †P-value < 0.02 for continuous trend. ††P-value < 0.001 for continuous trend. The estimated means (with upper 95% confidence limits) for (A) global longitudinal strain; (B) global circumferential strain; (C) global radial strain; (D) early diastolic (e′) tissue velocity; and (E) E/e′ ratio are shown by UACR quartile for all subjects and 3 subgroups after adjustment for speckle-tracking analyst, study site, image quality, age, sex, body mass index, estimated glomerular filtration rate, diabetes mellitus, coronary artery disease, systolic blood pressure, use of antihypertensive medication, history of smoking, left ventricular mass index, and ejection fraction. LVH = left ventricular hypertrophy; DM = diabetes mellitus; HTN = hypertension. Tissue velocities by speckle tracking are lower than values observed using tissue Doppler. Thus e′ tissue velocity is lower and E/e′ is higher than observed with tissue Doppler.

