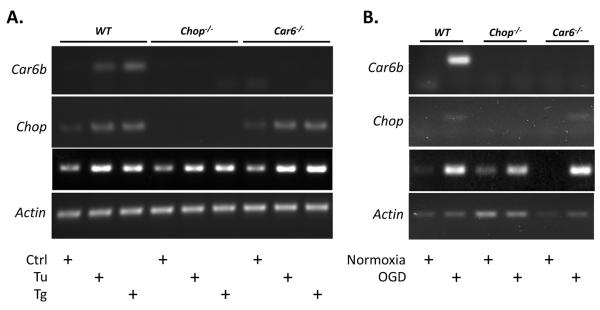
Figure 4. Characterization of WT, Car6−/− and CHOP−/− neurosphere models.

Representative RT-PCR of CHOP, Car6, BiP and Actin mRNA following 12 hours of treatment with (A) 250 nM Tu or Tg or (B) after 12 hours of OGD, followed by 6 hours of reperfusion.
