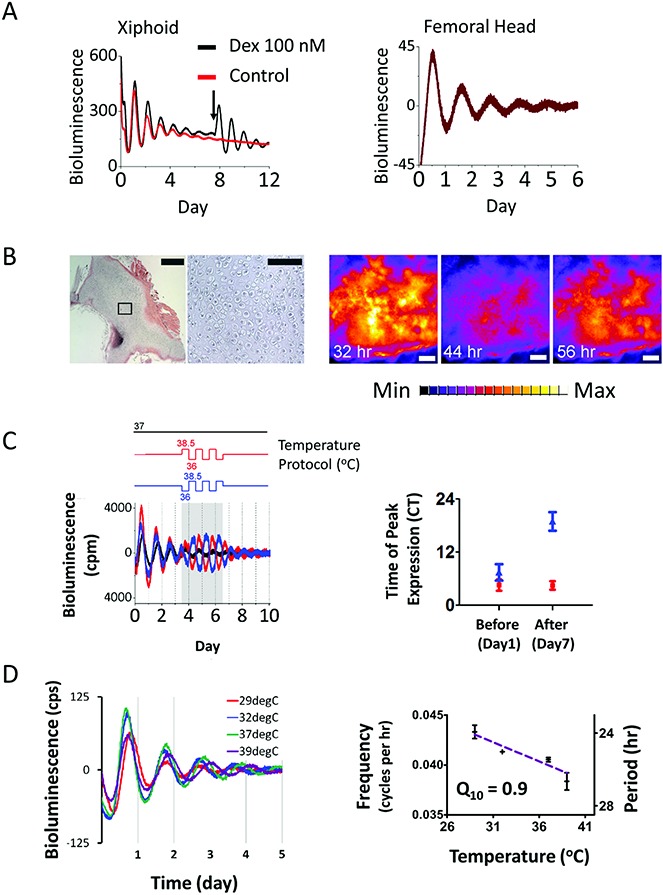
Figure 1.

Evidence of an autonomous circadian clock in mouse cartilage tissue. A, Representative bioluminescence traces (in counts per second) in cultures of xiphoid cartilage (mean ± SD period 24.67 ± 0.13 hours; n = 7) and articular cartilage from the femoral head (mean ± SD period 23.7 ± 0.6 hours; n = 4) of PER2::luc mice. Arrow indicates the time of treatment with 100 nM dexamethasone. B, Hematoxylin and eosin (H&E) staining (left) and high-sensitivity EM-CCD camera images (right) of xiphoid tissue. Left, A representative H&E–stained tissue section demonstrates typical morphologic features of the xiphoid cartilage (first panel; bar = 500 μm). The second panel is a higher-magnification view of the boxed area in the first panel (bar = 100 μm). Right, EM-CCD images of the xiphoid tissue were obtained at 32, 44, and 56 hours post–dexamethasone synchronization (bars = 300 μm). C, Temperature entrainment. Two xiphoid cartilage cultures (represented by red and blue lines) from the same animal were held under antiphase temperature cycles (alternating 12-hour cycles of 38.5°C/36°C; baseline temperature of 37°C). Left, Detrended trace (in counts per minute); shaded area represents enforcement of the temperature protocol. Right, Time of peak circadian expression on day 1 and day 7; CT0 = circadian time 0 (start of recording). On day 7, the 2 cultures had significantly different peak times (P = 0.0006 by paired t-test). D, Temperature compensation. Left, Representative detrended traces (in counts per second) in cartilage (n = 4) over a 10°C temperature range. Right, Frequency (reaction rate), calculated as 1/period. Temperature coefficient (Q10) = 0.9, line of best fit y = −0.00039x + 0.05422, R2 = 0.68. Results are the mean ± SEM.
