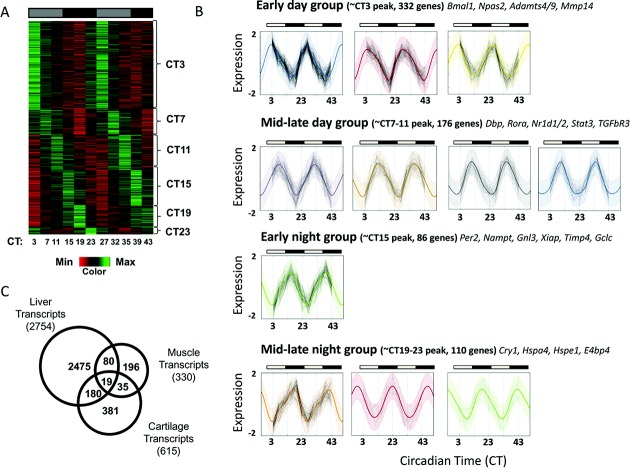
Figure 3.
Identification of the circadian transcriptome in mouse cartilage. A, Heat map depicting the expression level of the 615 circadian genes (represented by 705 probe sets), showing that 3.9% of the cartilage transcriptome is circadian, as identified using CircWave Batch (local false discovery rate < 0.1, equivalent to approximate R2 > 0.7) and JTKCycle (Bonferroni-adjusted P < 0.05). Genes are organized according to timing of peak expression. B, Clustering and identification of periodic functions. Each panel represents a single cluster, with normalized log-expression levels marked as connected points for each gene over time. Colored lines represent the inferred cluster-wise periodic function, with 2 standard deviations marked by the shaded area. Clusters fall into 4 broad categories, based on the time of peak expression. In A and B, gray-shaded bars represent subjective day, and solid black bars represent subjective night. C, Tissue specificity of cartilage clock-controlled genes. Venn diagram shows a comparison of cartilage circadian genes with previously published gene lists from studies of the liver and skeletal muscle of mice. The total number of genes identified as circadian in each tissue is shown in parentheses; areas of overlap indicate common genes.

